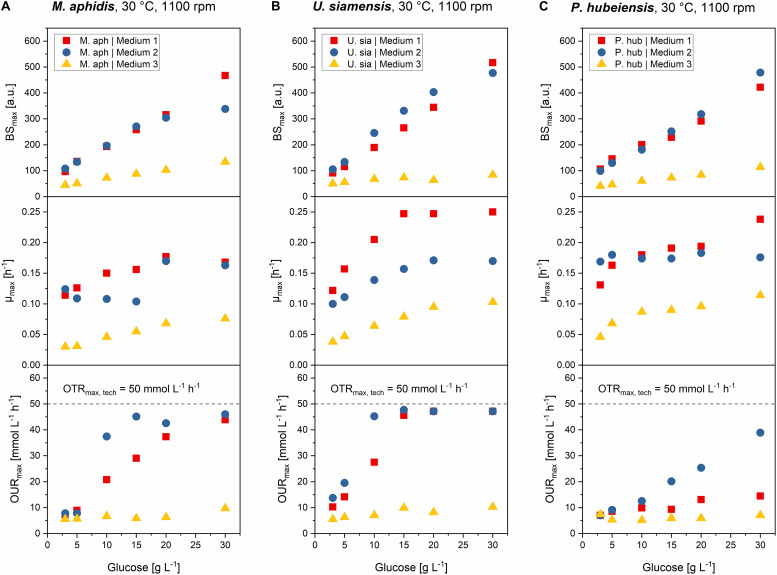
FIGURE 6.
Comparison of max. final backscatter BSmax, max. specific growth rate μmax and max. oxygen uptake rates OURmax for M. aphidis (A), U. siamensis (B), and P. hubeiensis pro tem. (C) in the three media with increasing medium concentrations from 3 to 30 g L–1 glucose equivalent. BSmax values were comparable between medium 1 and 2, and increased proportionally with medium concentration. Maximum growth rates μmax increased until the point of oxygen limitation. Oxygen limitation occurred when the OURmax values were equal to the OTRmax. The respective medium concentration that led to oxygen limitation was different for each species and medium.

