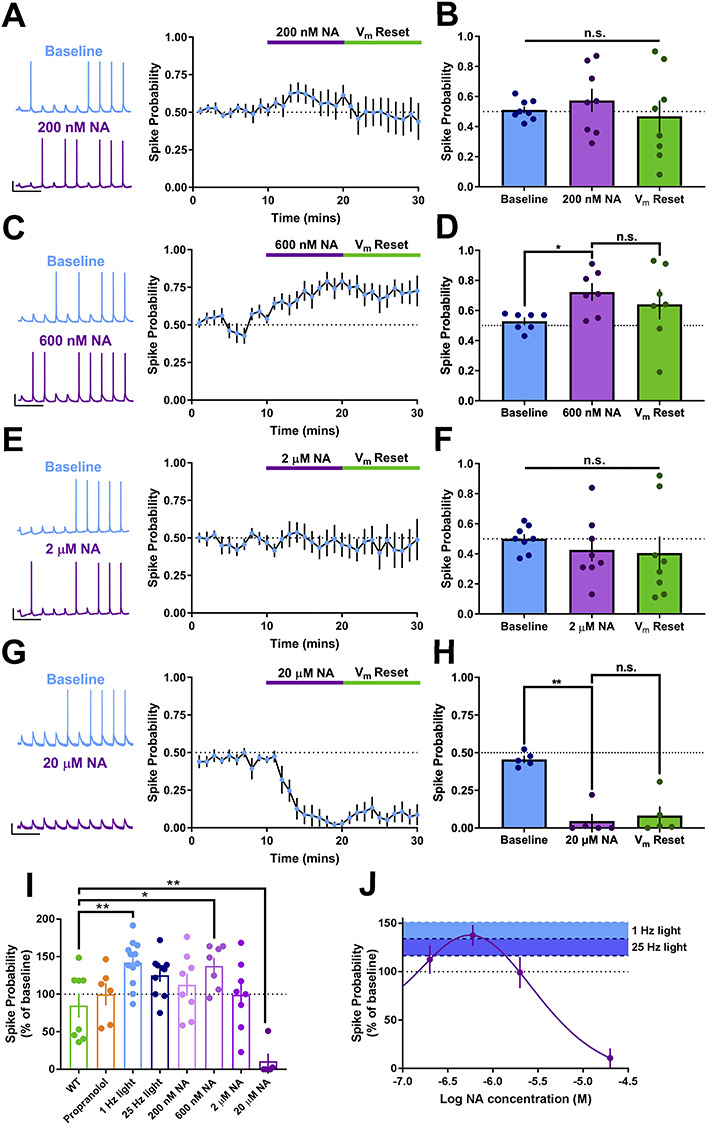
Figure 3.

Biphasic dose-response relationship for exogenous NA on CA1 spike output. (A–H) Example traces, averaged timecourse and grouped data for spike probability experiments using exogenous application of 200 nM (A and B), 600 nM (C and D), 2 μM (E and F) and 20 μM NA (G and H). (I) Percentage change in spike probability for all conditions. (J) Dose-response curve for change in spike probability with concentration of NA. Overlaid blue shading indicates the mean and SEM change in spike probability produced by 1 or 25 Hz light stimulation of endogenous NA release. Overlap between blue shading and dose-response curve indicates likely concentration of endogenous NA release. Scale bars = 20 mV, 250 ms.
