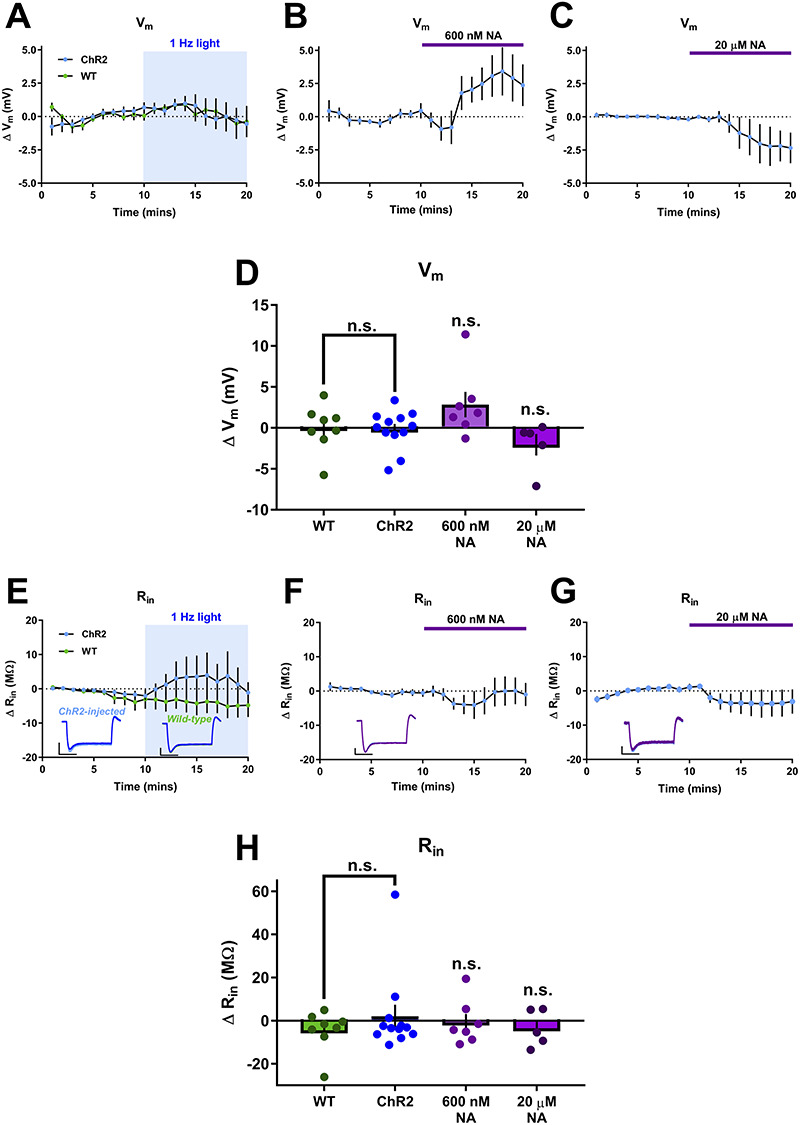
Figure 6.

Endogenous NA release does not modulate resting intrinsic cellular properties. (A–C) Timecourse of changes in resting membrane potential (Vm) from baseline showing no effect of endogenous NA release (A) or 600 nM NA (B) but a hyperpolarization caused by 20 μM NA (C). (D) Group data for effects of all conditions on Vm. (E–G) Timecourse of changes in input resistance (Rin) from baseline showing no effect of endogenous NA release (E), 600 nM NA (F) and 20 μM NA (G). Example traces are inset. Scales bars = 5 mV, 200 ms. (H) Group data for effects of all conditions on Rin.
