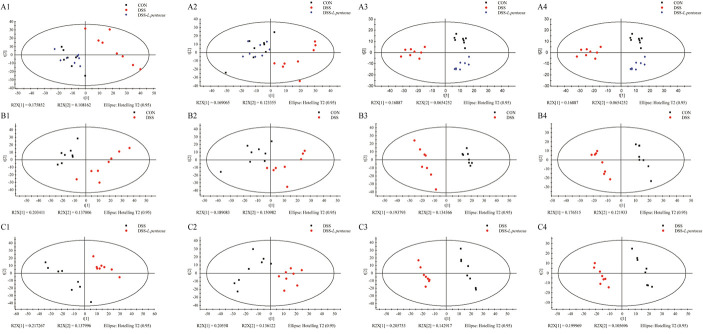
FIGURE 3.
Plots of the multivariate statistical comparisons between groups. (A1) PCA score plot of all samples (ESI+); (A2) PCA score plot of all samples (ESI-); (A3) PLS-DA score plot of all samples (ESI+); (A4) PLS-DA score plot of all samples (ESI-); (B1) PCA score plot of CON-DSS (ESI+); (B2) PCA score plot of CON-DSS (ESI-); (B3) PLS-DA score plot of CON-DSS (ESI+); (B4) PLS-DA score plot of CON-DSS(ESI-); (C1) PCA score plot of DSS-(DSS-L. pentosus) (ESI+); (C2) PCA score plot of DSS-(DSS- L. pentosus) (ESI-); (C3) PLS-DA score plot of DSS-(DSS-L. pentosus) (ESI+); (C4) PLS-DA score plot of DSS-(DSS-L. pentosus) (ESI-).

