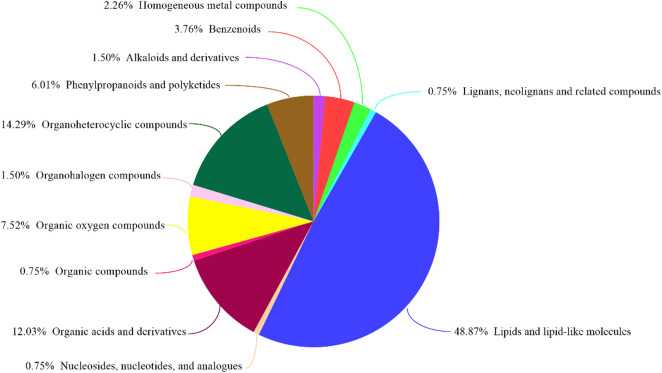
FIGURE 4.
HMDB compound classification. Based on the number of metabolites, the Human Metabolome Database (HMDB) level (Superclass, Class, or Subclass) classification and metabolite percentages are displayed. The different colors in each pie chart in the figure represent different HMDB classifications, and their area represents the relative proportion of metabolites in the classification.

