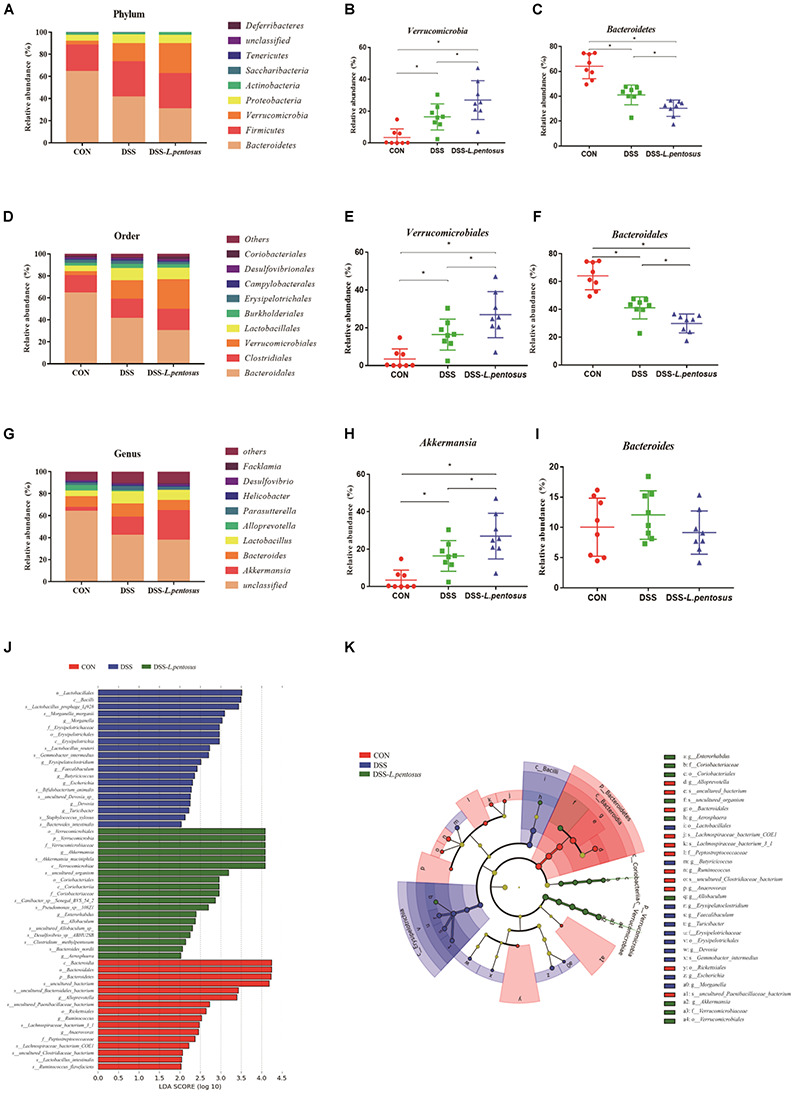
FIGURE 7.

Effects of different treatments on gut microbiota in mice. (A) Relative abundance of gut microbiota phyla; (B) percentage of Verrucomicrobia in each sample from the three groups; (C) percentage of Bacteroidetes in each sample from the three groups; (D) relative abundance of gut microbiota orders; (E) percentage of Verrucomicrobiales in each sample from the three groups; (F) percentage of Bacteroidales in each sample from the three groups; (G) relative abundance of gut microbiota genera; (H) percentage of Akkermansia in each sample from the three groups; (I) percentage of Bacteroides in each sample from the three groups. (J) LDA score, an LDA score greater than 4 was considered to indicate an important contributor to the model; (K) LEfSe taxonomic cladogram, with different colors indicating the enrichment of certain taxa in the control (red), DSS (blue), and DSS-L. pentosus (green) groups. Data are mean ± SD (n = 8) and analyzed by one-way ANOVA. *p < 0.05.
