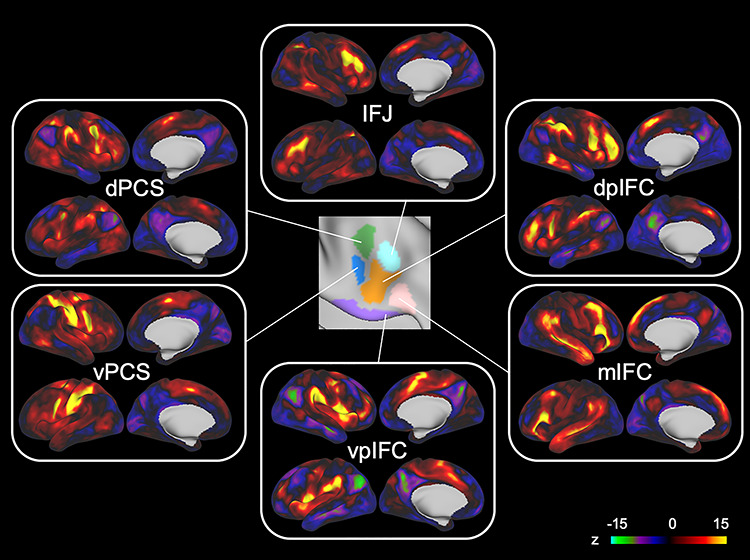
Figure 3.

Cortical correlation maps for six modules in the group data. The cortical correlation maps were generated by calculating the functional connectivity between each of the six parcels in the right IFC and the whole cerebral cortex. The six parcels had distinct connectivity patterns with the cerebral cortex and were used for subsequent analyses to assign the IFC parcels of individual brains.
