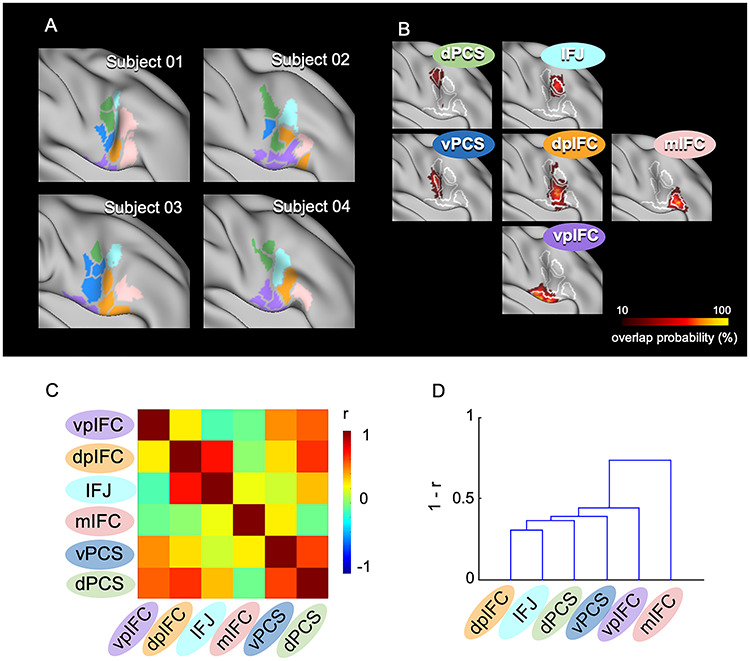
Figure 4.

IFC parcels of individual brains assigned to six modules. (A) The right IFC parcels were assigned to the six modules in four representative subjects. The colors in the parcels indicate the six modules shown in Fig. 1, and the gray parcels indicate parcels not assigned to any of the six modules. (B) Vertex-wise probabilistic maps of the six modules in the right IFC averaged across subjects. (C) The matrix of similarity of the cortical correlation maps among the six modules, averaged across subjects. The color scale indicates the correlation coefficient. (D) The dendrogram of the similarity matrix among the six modules.
