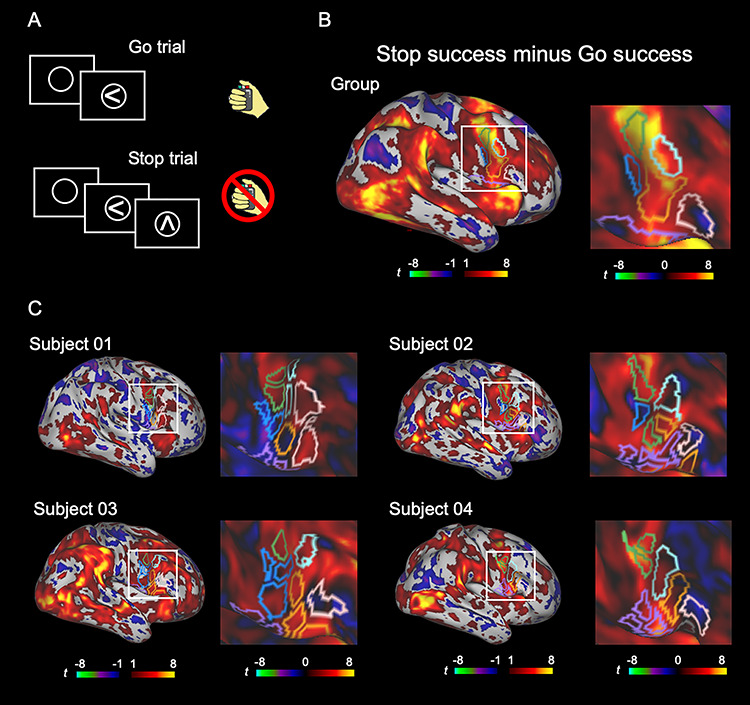
Figure 5.

The vertex-wise brain activity during response inhibition. (A) The basic structure of the stop-signal task. (B, C) Vertex-wise brain activity maps in the group (B) and in the four representative subjects (C) to inspect the spatial extent of the brain activity. A general linear model was applied to each vertex, and Stop success and Go success trials were contrasted. The color scales indicate t values in the vertices.
