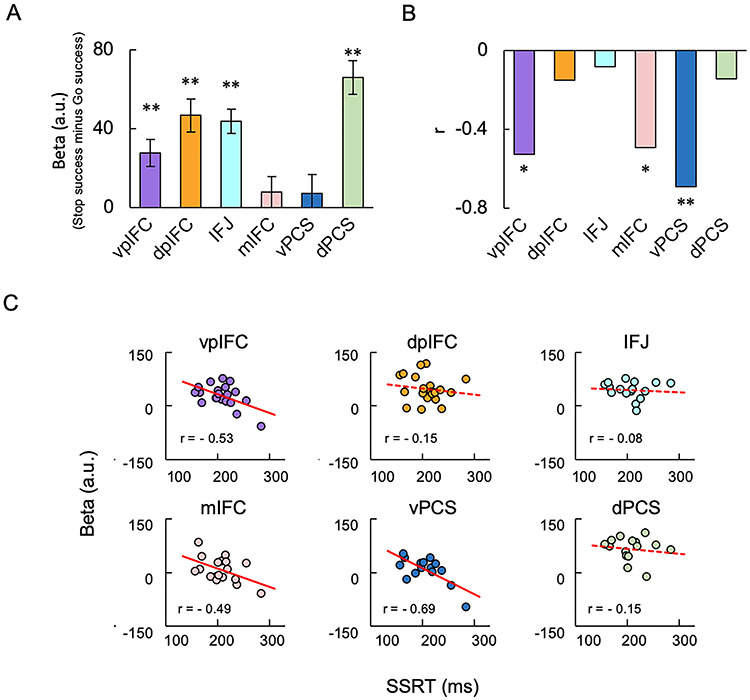
Figure 6.

Brain activity and brain-behavior correlation in six modules during response inhibition. (A) The brain activity in the six modules in the right IFC averaged across subjects. Error bars indicate the standard error of means of the subjects. **P < 0.01, one-sample t-test. (B) The correlation between the brain activity and SSRT in the six modules. *P < 0.05; **P < 0.01. (C) The scatter plots of the correlation in the six modules.
