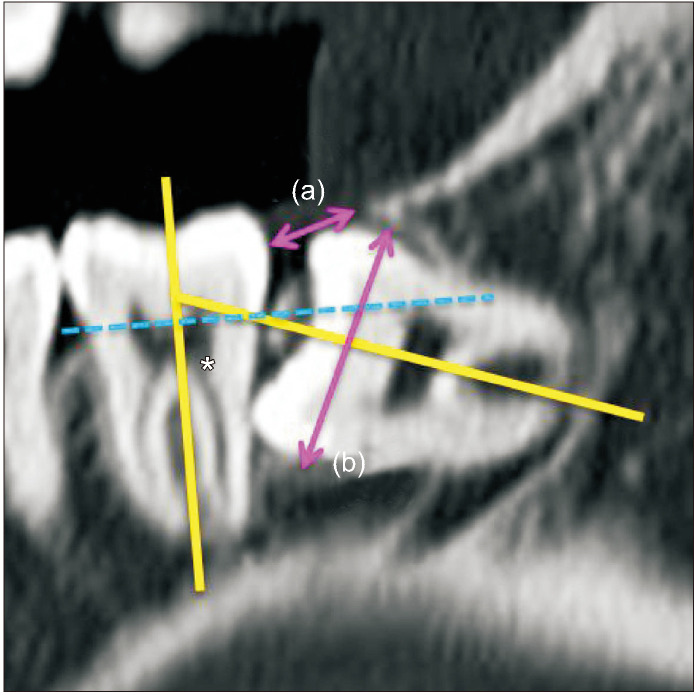
Fig. 2.
Measurement and classification of the impacted third molars in cone-beam computed tomography according to a previous study conducted by Kim et al.5. The spatial relationship was classified based on the angle measured between the long axis of the impacted third molar and the adjacent second molar (yellow lines and an asterisk mark). Depth was classified based on the line connecting the cementoenamel junction of the adjacent second molar (dotted blue line). Ramus relationship/space available was subcategorized based on the ratio between the distance from the ascending ramus to the distal of the second molar (a) and the diameter of the impacted third molar (b) (pink arrows).

