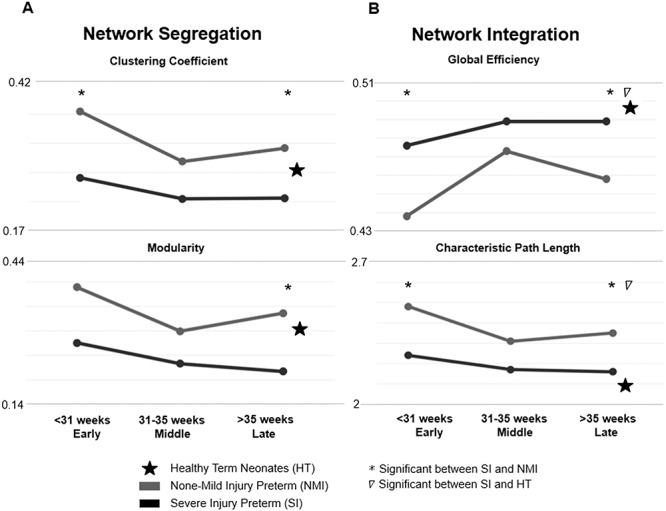
Figure 4.

Graph theory analysis of sulcation-based covariance networks. (A) The SI group exhibits significantly increased levels of network segregation (increased clustering coefficient and increased modularity). While the clustering coefficient is significantly increased in both the first- and last-time frames, modularity was significantly increased in only the third time frame. (B) The SI group displays significantly decreased levels of network integration (lower global efficiency, higher characteristic path length). For all integration metrics, significant differences between NMI and SI groups are found in both the early and late time frames.
