
Figure 2.
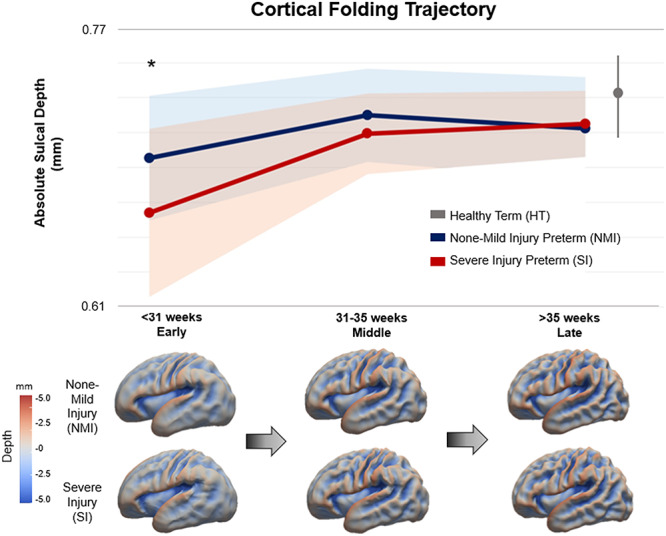
Cortical folding trajectory of NMI and SI preterm neonates. Both NMI and SI groups exhibit similar trends of rapid cortical folding expansion in the early and middle stages of the third trimester, thereafter, plateauing by the late stage. However, the SI group displays significantly shallower sulci in the early stage (P = 0.01; t = 2.67), while no differences are found in the middle or late time frames due to their faster growth. The average sulcation value of HT neonates is plotted at term (40th week of gestation). Sulcation values of HT neonates are higher than both NMI and SI preterm born neonates, although not significantly different. For NMI and SI preterm groups, circles represent their means and shaded bands represent their standard deviations. The standard deviation for HT infants is shown as the vertical gray line to the right of the graph.