Figure 3.

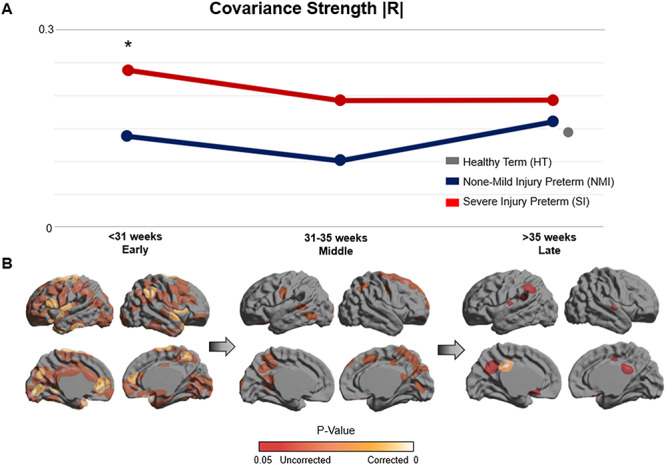
Network-level structural covariance of cortical sulcation. (A) The line graph depicts the developmental trajectory of global covariance strength |R| in NMI and SI preterm neonates. Inverted from trends exhibited in cortical folding, the SI group displays significantly increased covariance strength (P = 0.002; permutation test), suggesting maturational hyper-covariance in the early time frame. No significant differences between the NMI and SI groups are found in the middle or late time frames. Covariance strength of HT neonates is also plotted in gray and appears to lie within similar range as both NMI and SI preterm neonates. (B) Regions of significant differences between NMI and SI groups in terms of global covariance strength are mapped across all time points. The early stage exhibits the most widespread significant differences, while such differences gradually diminish throughout the middle and late stages. Residual differences of global covariance strength persist up until the late stage of the third trimester.
