
Figure 7.
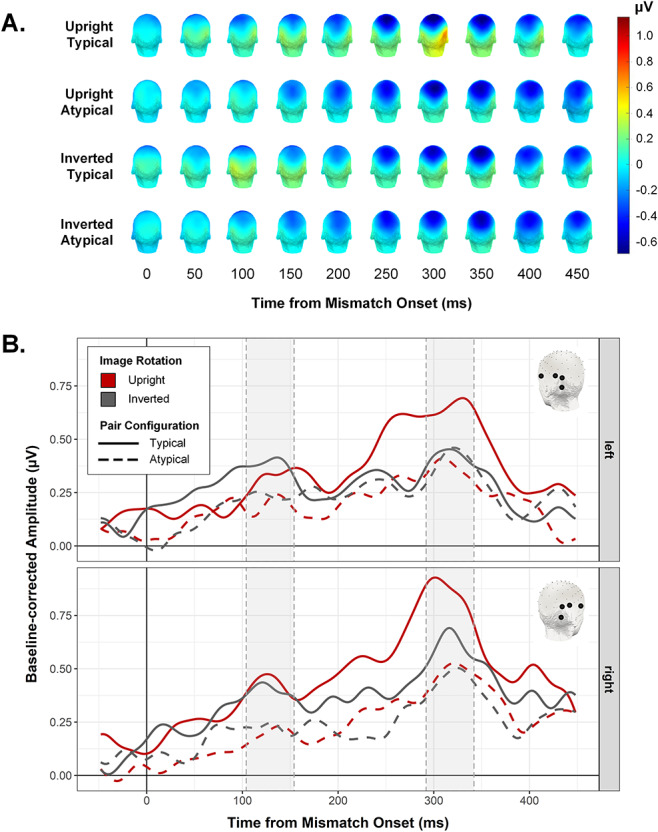
(A) Scalp topographies for each condition, shown at 50 ms intervals following mismatch onset. (B) Mismatch-selective waveforms for the condition in symmetrical left (top row) and right (bottom row) ROIs. Shaded regions indicate peak windows subjected to statistical analysis (see Fig. 6C).