Figure 1.

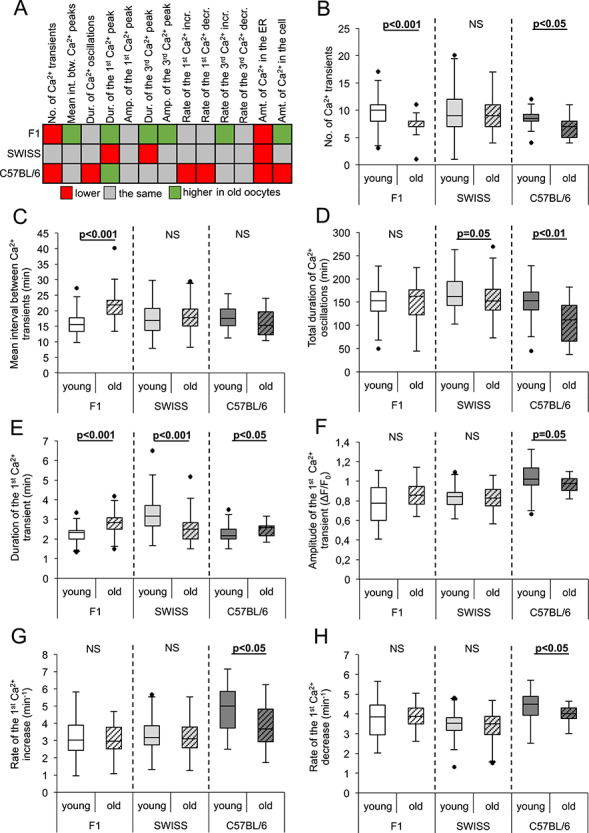
Effect of maternal aging on the pattern of fertilization-induced Ca2+ oscillations in oocytes from F1, SWISS, and C57BL/6 mice. (A) Summary of the alterations induced by maternal aging in Ca2+ oscillations in fertilized oocytes. Red marks values lower, gray—the same, and green—higher in old oocytes than in their young counterparts. The amounts of Ca2+ in the ER and the whole cell correspond to the AUCs for the TG- and A23187-induced Ca2+ increases, respectively. (B) The number of Ca2+ transients in young (n = 57 F1, 93 SWISS, 36 C57BL/6) and old (n = 30 F1, 74 SWISS, 17 C57BL/6) oocytes. (C) Mean interval between two consecutive Ca2+ transients calculated for the first 2 h of Ca2+ oscillations in young (n = 57 F1, 92 SWISS, 36 C57BL/6) and old (n = 29 F1, 74 SWISS, 17 C57BL/6) oocytes. (D) The total duration of Ca2+ oscillations in young (n = 57 F1, 92 SWISS, 36 C57BL/6) and old (n = 29 F1, 74 SWISS, 17 C57BL/6) oocytes. (E) Duration and (F) amplitude of the 1st Ca2+ transient in young (n = 55 F1, 92 SWISS, 36 C57BL/6) and old (n = 27 F1, 73 SWISS, 18 C57BL/6) oocytes. (G) Rate of Ca2+ increase during the 1st Ca2+ transient in young (n = 54 F1, 92 SWISS, 36 C57BL/6) and old (n = 27 F1, 74 SWISS, 18 C57BL/6) oocytes. (H) Rate Figure 1. (continued) of Ca2+ decrease during the 1st Ca2+ transient in young (n = 56 F1, 92 SWISS, 36 C57BL/6) and old (n = 30 F1, 74 SWISS, 16 C57BL/6) oocytes. (B–H) Graphs present medians and the 1st and the 3rd quartile values. The ends of the whiskers are set at 1.5*IQR above the third quartile and 1.5*IQR below the first quartile. Dots show the minimum and maximum values if they are outside the range (outliers).
