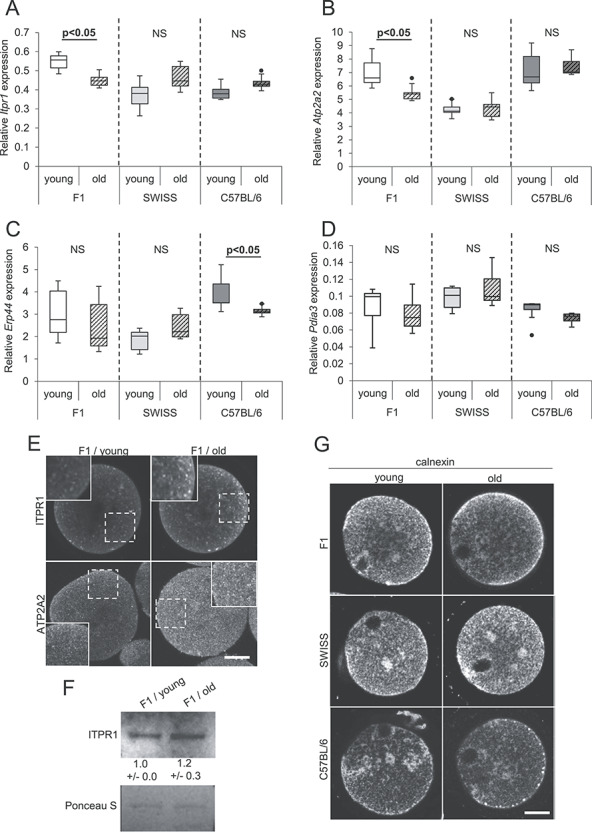
Figure 3.

Distribution of ER cisterns and expression of genes involved in Ca2+ homeostasis in oocytes from young and old F1, SWISS, and C57BL/6 mice. (A–D) Relative expression of mRNA for (A) Itpr1, (B) Atp2a2, (C) Erp44, and (D) Pdia3 genes in young and old oocytes. PCR analysis was repeated six times. (E) Representative images of immunofluorescence stainings for ITPR1 and ATP2A2 in F1 young (n = 49 and 29, respectively) and old (n = 13 and 28, respectively) oocytes. Regions marked with dashed line are magnified in the inserts. Scale bar 20 μm. (F) Western blot analysis for ITPR1 in F1 young and old oocytes. Numbers below the blots present mean results (±SD) of the densitometric analysis from three experiments. Ponceau S staining was used to confirm an equal sample loading. (F) Representative images of immunofluorescence stainings for calnexin, the ER marker, in young (n = 29 F1, 18 SWISS, 12 C57BL/6) and old (n = 34 F1, 20 SWISS, 8 C57BL/6) oocytes.
