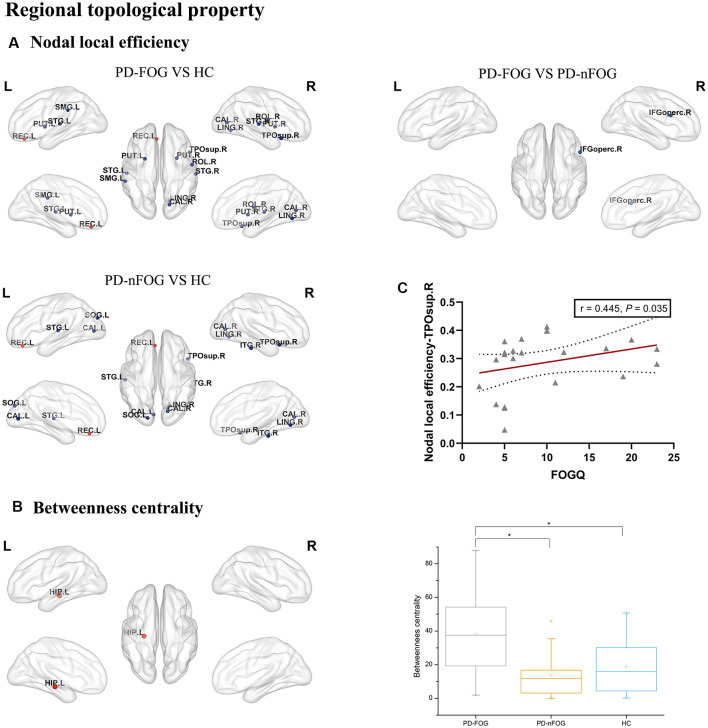
Figure 2.
Brain regions showing abnormal regional topologic properties in PD-FOG patients relative to PD-nFOG patients and HCs. The cold color representing the decreased regional topologic properties, and the warm color representing the increased regional topologic properties. (A) Brain regions showing abnormal nodal local efficiency in PD-FOG patients relative to PD-nFOG patients and HCs. (B) Brain regions showing increased betweenness centrality in the left hippocampus (HIP.L) in PD-FOG patients compared with PD-nFOG patients and HCs. (C) Plots showing the correlation between nodal local efficiency in the right temporal pole: superior temporal gyrus and FOGQ scores in PD-FOG patients. *Means a significant statistical difference between the two groups. Network visualization was obtained with BrainNet viewer (http://www.nitrc.org/projects/bnv/) software packages. Abbreviations: PD-FOG, Parkinson’s disease patients with freezing of gait; PD-nFOG, Parkinson’s disease patients without freezing of gait; HC, healthy control; FOGQ, Freezing of Gait Questionnaire; ROL, Rolandic operculum; REC, Gyrus rectus; CAL, Calcarine fissure and surrounding cortex; LING, Lingual gyrus, SMG, Supramarginal gyrus; PUT, Putamen; STG, superior temporal gyrus; TPOsup, Temporal pole: superior temporal gyrus; IFGoperc, Inferior frontal gyrus, opercular part; ITG, inferior temporal gyrus; L, Left; R, Right.

