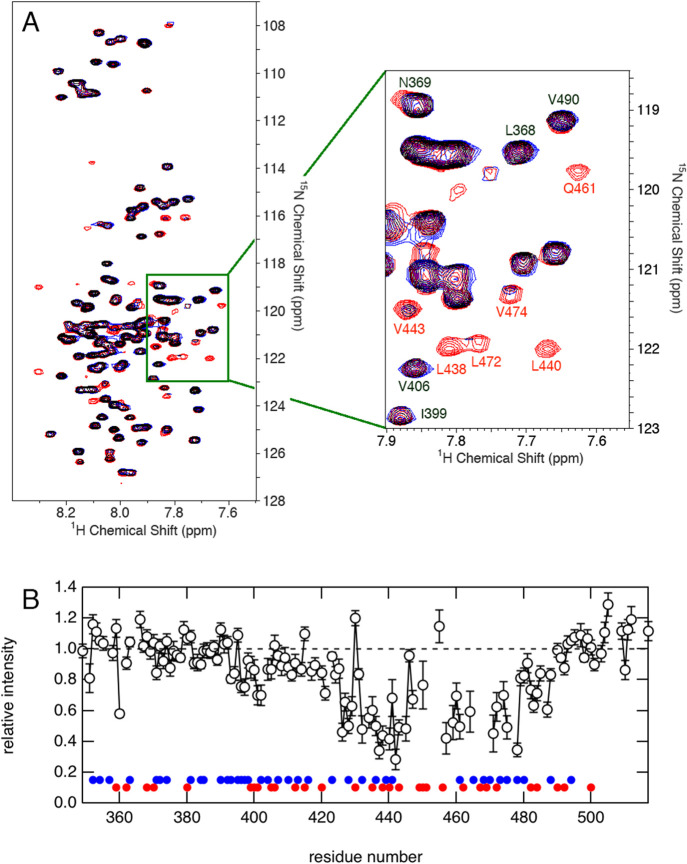
Figure 2.
(A) Overlay of the 1H-15N HSQC spectra of 15N-QB domains in the absence (red) and presence (blue) of an excess amount of unlabeled QB domains at pH 7.3 and 4°C. (B) The relative peak intensity of 1H-15N HSQC spectra plotted against the residue number of the QB domain. The intensity in the presence of a 10-fold amount of 14N-protein relative to that in its absence is shown. The position of glutamine and aliphatic (Val, Leu, and Ile) residues is indicated by blue and red circle, respectively.

