Figure 1.

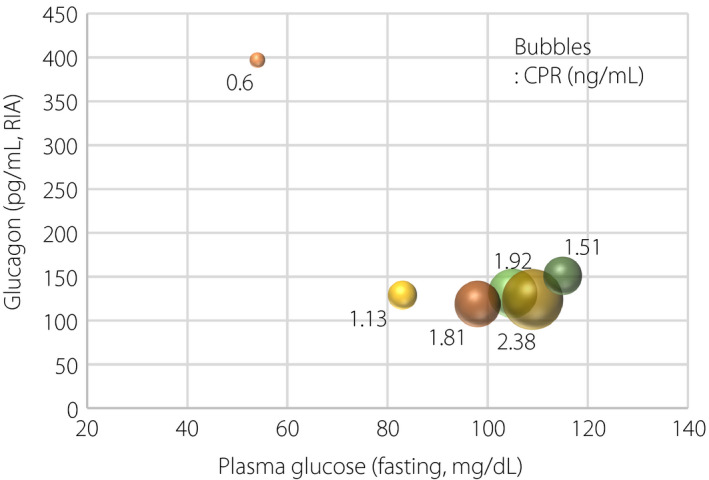
Relationships between fasting plasma glucose, glucagon and C‐peptide reactivity (CPR). Size of bubbles reflects CPR level as noted beside each bubble. RIA, radioimmunoactivity.

Relationships between fasting plasma glucose, glucagon and C‐peptide reactivity (CPR). Size of bubbles reflects CPR level as noted beside each bubble. RIA, radioimmunoactivity.