
Figure 3.
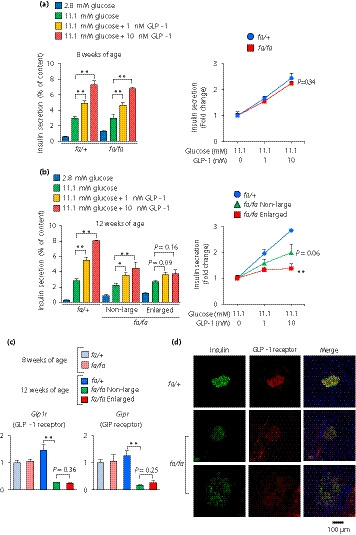
The enlarged islets of Zucker fatty diabetes mellitus (ZFDM) fa/fa rats show diminished incretin‐induced insulin secretion. (a,b) Insulin secretion from isolated islets of ZFDM rats at (a) 8 and (b) 12 weeks‐of‐age. The islets were stimulated with glucose and glucagon‐like peptide 1 (GLP‐1; n = 5–8). Insulin secretion was normalized by cellular insulin content (left) and presented as fold‐change relative to the amount of insulin secretion at 11.1 mmol/L glucose (right). The data are expressed as the mean ± standard error of the mean. Holm’s method was used for evaluation of statistical significance versus 11.1 mmol/L glucose (left) or versus fa/+ (right). *P < 0.05; **P < 0.01. (c) Expression levels of genes encoding incretin receptors. Messenger ribonucleic acid expression levels are presented as fold‐change relative to those of fa/+ rats at 8 weeks of age (n = 3). The data are expressed as the mean ± standard error of the mean. Holm’s method was used for evaluation of statistical significance. **P < 0.01. (d) Immunostaining of pancreata of ZFDM rats at 12 weeks‐of‐age. Green, insulin; red, GLP‐1 receptor; Blue, 4′,6‐diamidino‐2‐phenylindole.