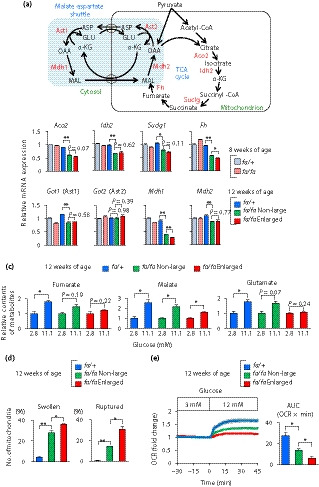
Figure 6.

The enlarged islets show abnormalities in mitochondrial morphology and function. (a) A schematic view of the tricarboxylic acid (TCA) cycle and malate‐aspartate (MA) shuttle. Metabolites are shown in black; and proteins are shown in red. (b) Expression levels of genes associated with the TCA cycle and MA shuttle. Messenger ribonucleic acid (mRNA) expression levels are presented as fold‐change relative to those of fa/+ rats at 8 weeks‐of‐age (n = 3). The data are expressed as the mean ± standard error of the mean. Holm’s method was used for evaluation of statistical significance. *P < 0.05; **P < 0.01. (c) Metabolites associated with the TCA cycle and MA shuttle. Contents of metabolites are presented as fold‐change relative to those under low glucose (2.8 mmol/L) condition (n = 3). The data are expressed as the mean ± standard error of the mean. Holm’s method was used for evaluation of statistical significance. *P < 0.05. (d) The percentages of swollen and ruptured mitochondria (n = 3 each). The data are expressed as the mean ± standard error of the mean. Holm’s method was used for evaluation of statistical significance. *P < 0.05; **P < 0.01. (e) The oxygen consumption rate (OCR) of Zucker fatty diabetes mellitus islets. The OCR values obtained under high‐glucose (12 mmol/L) condition are presented as fold‐change relative to those under low‐glucose (3 mmol/L) condition (left), and are also presented as the area under the curve (AUC) during high‐glucose stimulation (right; n = 3–4). The data are expressed as the mean ± standard error of the mean. Holm’s method was used for evaluation of statistical significance. *P < 0.05. Aco2, aconitase 2; Idh2, isocitrate dehydrogenase (NADP(+)) 2; Suclg1, succinate‐CoA ligase GDP/ADP‐forming subunit alpha; Fh, fumarate hydratase; Got1, glutamic‐oxaloacetic transaminase 1; Got2, glutamic‐oxaloacetic transaminase 2; Mdh1, malate dehydrogenase 1; Mdh2, malate dehydrogenase 2.
