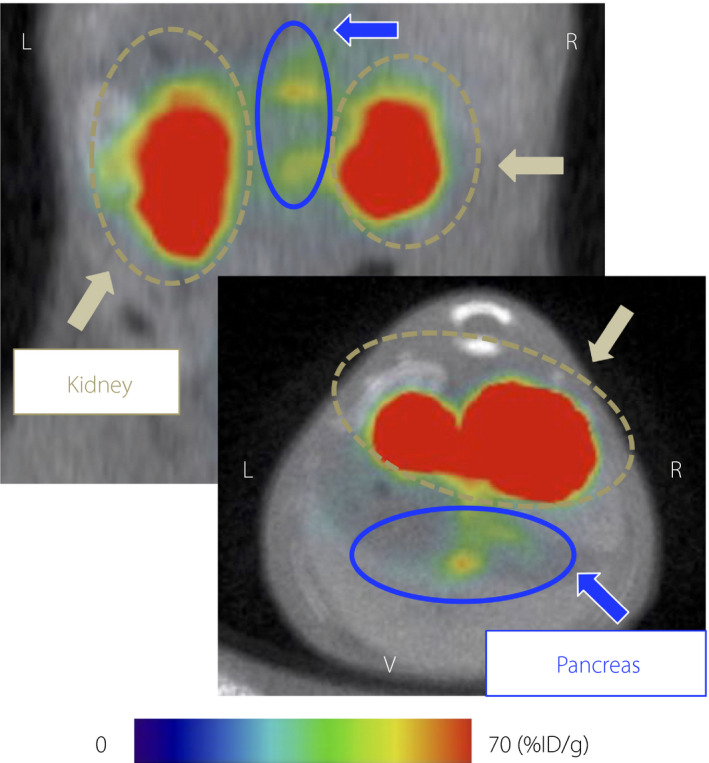
Figure 1.

Representative 111Indium‐labeled exendin‐4 derivative single‐photon emission computed tomography/computed tomography images of a 10‐week‐old RCS‐10 male mouse. Coronal and axial images are shown in the upper and lower panels, respectively. Maximum to minimum intensity: red > orange > yellow > green > blue > black. Signals from the pancreas, blue arrows and circles; signals from the kidney, yellow brown arrows and circles. %ID/g; pancreatic uptake values per injected dose of the probe; L, left; R, right; V, ventral.
