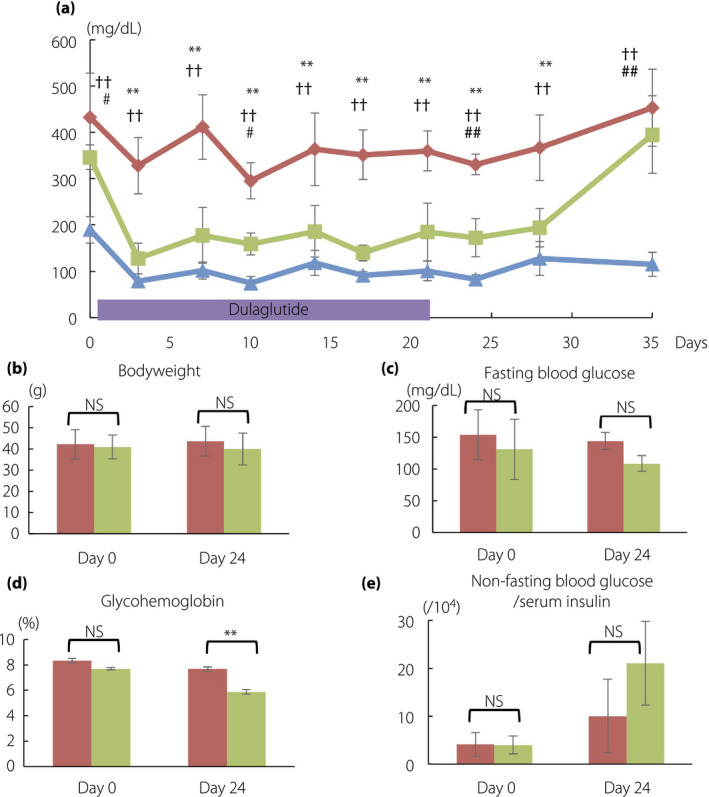
Figure 2.

Glycemic changes and characteristics during observation in mice. (a) Changes of non‐fasting blood glucose levels. On day 24, five mice showing >300 mg/dL of glucose level were grouped as non‐responders, whereas four mice showing <300 mg/dL were grouped as responders. (b) Bodyweight, (c) fasting blood glucose, (d) mice hemoglobin and (e) non‐fasting blood glucose per serum insulin levels are shown. Non‐responders, red rhombi and bars (n = 5); responders, green squares and bars (n = 4); non‐diabetic control mice, blue triangles and bars (n = 3). The data are expressed as the mean ± standard deviation. Responders versus non‐responders, *P < 0.05, **P < 0.01; non‐responders versus control, † P < 0.05, †† P < 0.01; responders versus control, # P < 0.05, ## P < 0.01. NS, not significant.
