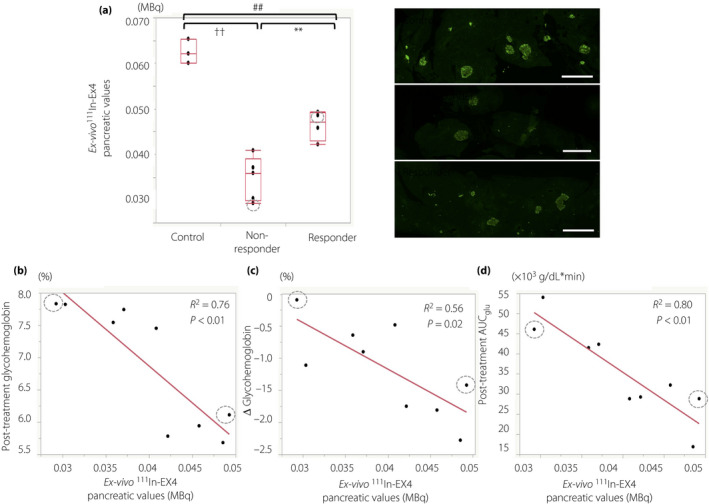
Figure 4.

Ex vivo 111Indium‐exendin‐4 (111In‐Ex4) pancreatic values and dulaglutide’s glucose‐lowering effects. Box‐and‐whisker plot for ex vivo 111In‐Ex4 pancreatic values in non‐diabetic control, responders and non‐responders. The box contains the 25th to 75th percentiles of the dataset. The whiskers mark the highest or lowest value of each group. Representative images of the insulin‐positive area of the pancreas in each group (right column). Simple linear regression analysis for (b) ex vivo 111In‐Ex4 pancreatic values with post‐treatment glycohemoglobin levels, (c) changes of glycohemoglobin levels between baseline and post‐treatment, and (d) post‐treatment glucose area under the curve during 2 h of oral glucose tolerance test (OGTT_AUCglu) are shown. Mice receiving intraperitoneal streptozotocin infusions are shown with gray dotted circles. Scale bar indicates 300 μm. Responders versus non‐responders, **P < 0.01; non‐responders versus control, †† P < 0.01; responders versus control, ## P < 0.01.
