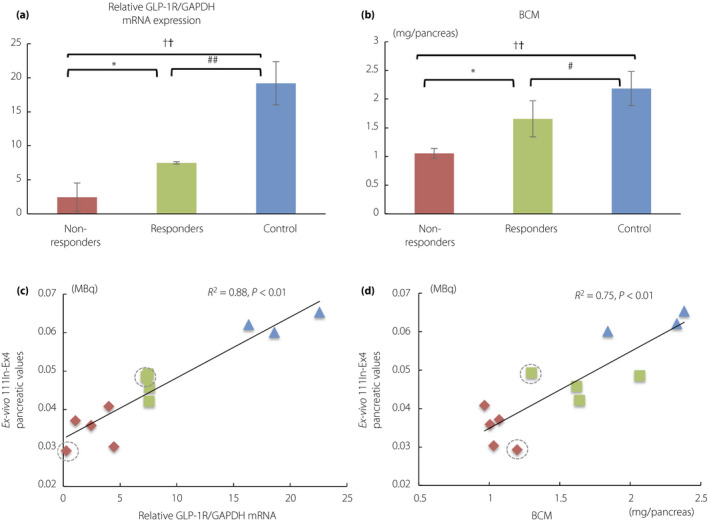
Figure 5.

(a) Glucagon‐like peptide‐1 receptor (GLP‐1R) messenger ribonucleic acid (mRNA) expression levels and (b) β‐cell mass (BCM) in each group. Scatterplots show significant correlation between ex vivo 111Indium‐exendin‐4 (111In‐Ex4) pancreatic values and (c) GLP‐1R mRNA expression levels as well as (d) β‐cell mass (BCM). Non‐responders, red rhombi and bars (n = 5); responders, green squares and bars (n = 4); non‐diabetic control mice, blue triangles and bars (n = 3). Mice receiving intraperitoneal streptozotocin infusions are shown with gray dotted circles. The data are expressed as the mean ± standard deviation. Responders versus non‐responders, *P < 0.05, **P < 0.01; non‐responders versus control, † P < 0.05, †† P < 0.01; responders versus control, # P < 0.05, ## P < 0.01. GAPDH, glyceraldehyde 3‐phosphate dehydrogenase; NS, not significant.
