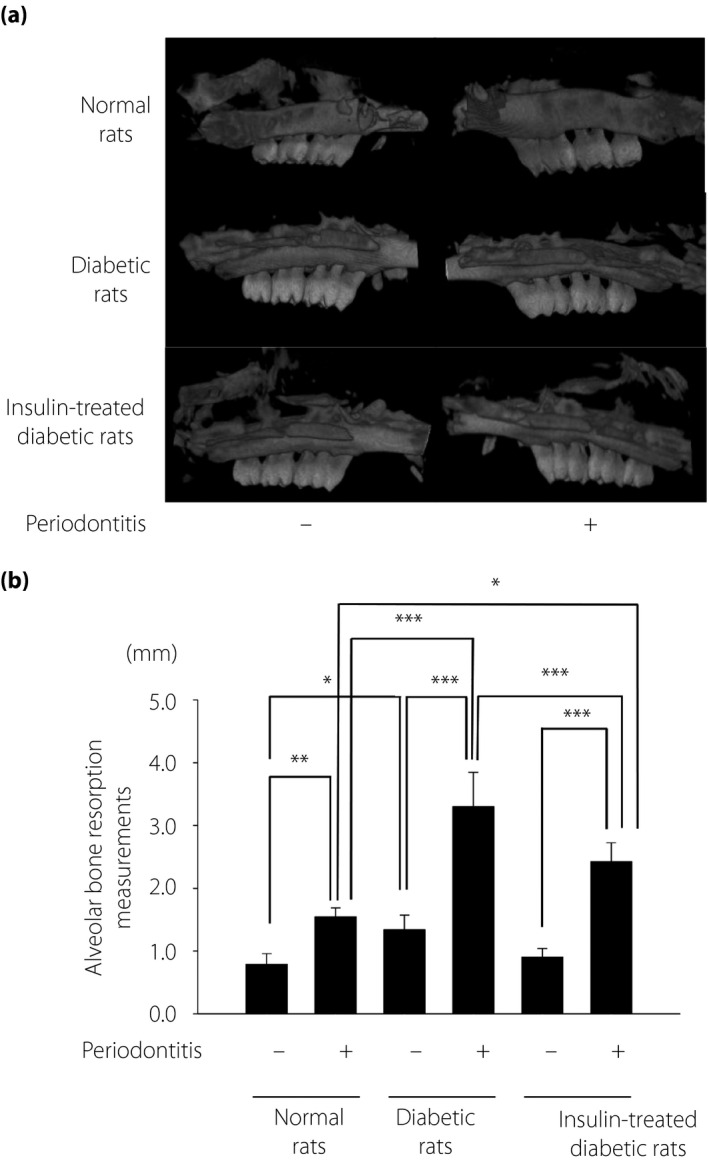
Figure 3.

Micro‐computed tomography images of the maxillae 2 weeks after the induction of periodontitis. (a) Representative micro‐computed tomography image of the control and the periodontitis sides in the normal and diabetic rats. (b) Alveolar bone absorption was measured as the distance from the mesial buccal cement–enamel junction to the alveolar bone crest of the second molar. The results are expressed as the mean ± standard error of the mean (n = 6). *P < 0.05, ** P < 0.01, ***P < 0.001.
