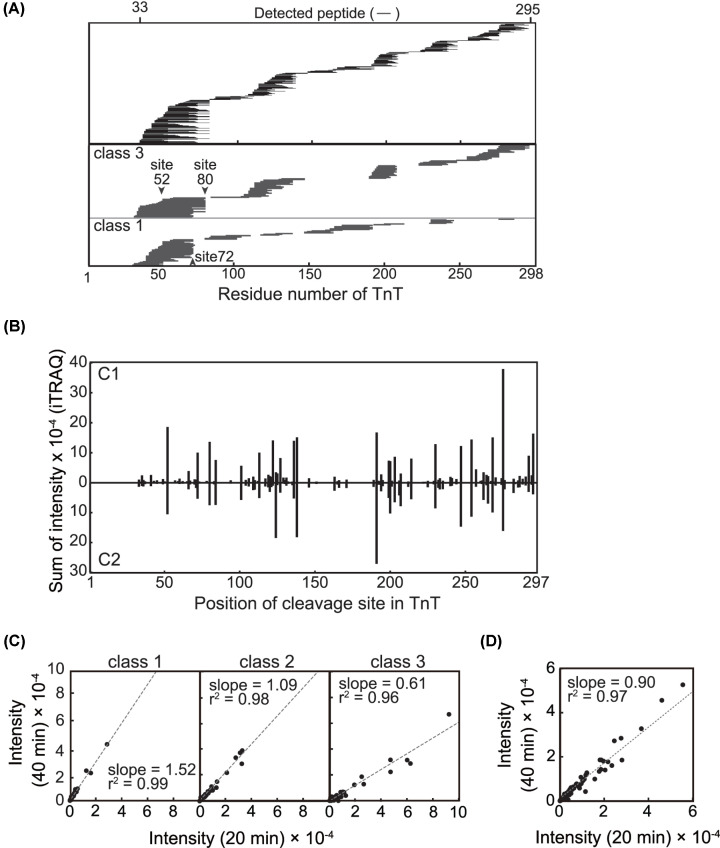
Figure 2. Peptide-based characterization of TnT digestion by calpain.
(A) Peptide map of the TnT. (upper panel) TnT was digested by C1 or C2 for 20 min (lanes 3 and 6 in Figure 1) and 40 min (lanes 4 and 5 in Figure 1), labeled with iTRAQ reagents and analyzed by LC-MS/MS (see ‘Materials and methods’ section). The position of 242 distinct peptides of TnT is depicted by horizontal lines. The identified peptide spans 33-295 aa of TnT sequence yielding 88.6 % coverage. Positions of peptides in class 1 (lower panel) and 3 (middle panel) generated by C1 digestion, whose relative intensities increased and decreased between 20 and 40 min, respectively, are represented schematically. Please see the description about the class in legend of (C) and (D). (B) Overview of cleavage site for calpain. Sites of cleavage by calpain are represented by both the N-terminal and C-terminal ends of the identified peptides. As an index of cleavage frequency at each peptide bond, the intensities of the iTRAQ reagent derived from the corresponding peptides were summed (Supplementary Table S1). Sites of cleavage by C1 and C2 did not significantly differ from each other. The relative frequency of each cleavage event shows some difference. Time-dependence of TnT digestion by (C) C1 and (D) C2. For all the distinctive peptides identified, relative intensities acquired after 40-min digestions were plotted against those for the 20-min reaction. Each dot corresponds to an individual peptide. C1 cleavage products were categorized into three classes based on the ratio of their intensities at 40 versus 20 min (R40m/20m) in order to draw regression lines with correlation factors comparable to those for peptides generated by C2 digestion. Class1, R40m/20m > 1.25; class2, 1.25 > R40m/20m > 0.8; class 3, R40m/20m < 0.8.

