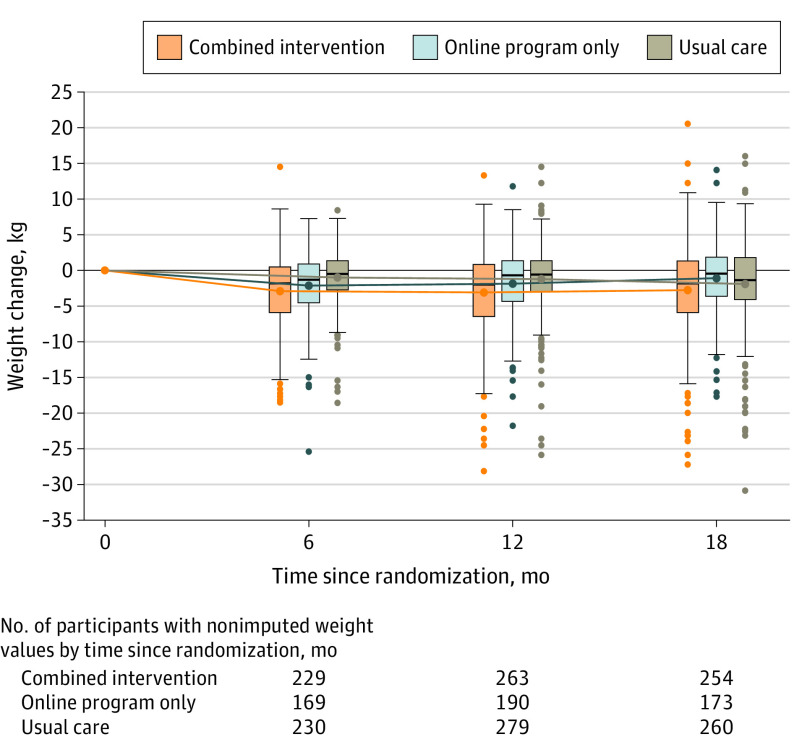
Figure 2. Mean Weight Change at 6, 12, and 18 Months.
The boxplots were created using the raw data from the first round of multiple imputation. The boxes are staggered horizontally around each time point to avoid superimposition. The boxes indicate the 25th and 75th percentiles of the data, and the horizontal lines within the boxes indicate the median values. The whiskers indicate the highest and lowest values within 1.5 times the interquartile range and the dots outside the whiskers are outliers. The lines show the mean weight change at each time point (indicated by the dots within the boxes) from repeated-measures linear regression models adjusted for age, sex, race/ethnicity, educational level, and medical conditions (type 2 diabetes, hypertension, and hyperlipidemia). Clinic type (community-based clinic, hospital-based, or community health center) was included as a fixed effect. Clinic, physician, and patient were included as random effects. All 840 patients were included in the models. Fully conditional specification multiple imputation with 25 imputations was used to estimate missing weights and other outcomes and covariates and was based on available data for 91 patient variables. The estimates and 95% CIs for the mean weight change from the models appear in Table 2.

