
Extended Data 2. Copper is both necessary and sufficient for autophagy induction and signaling in a MAPK signaling independent fashion, upstream of ATG5.
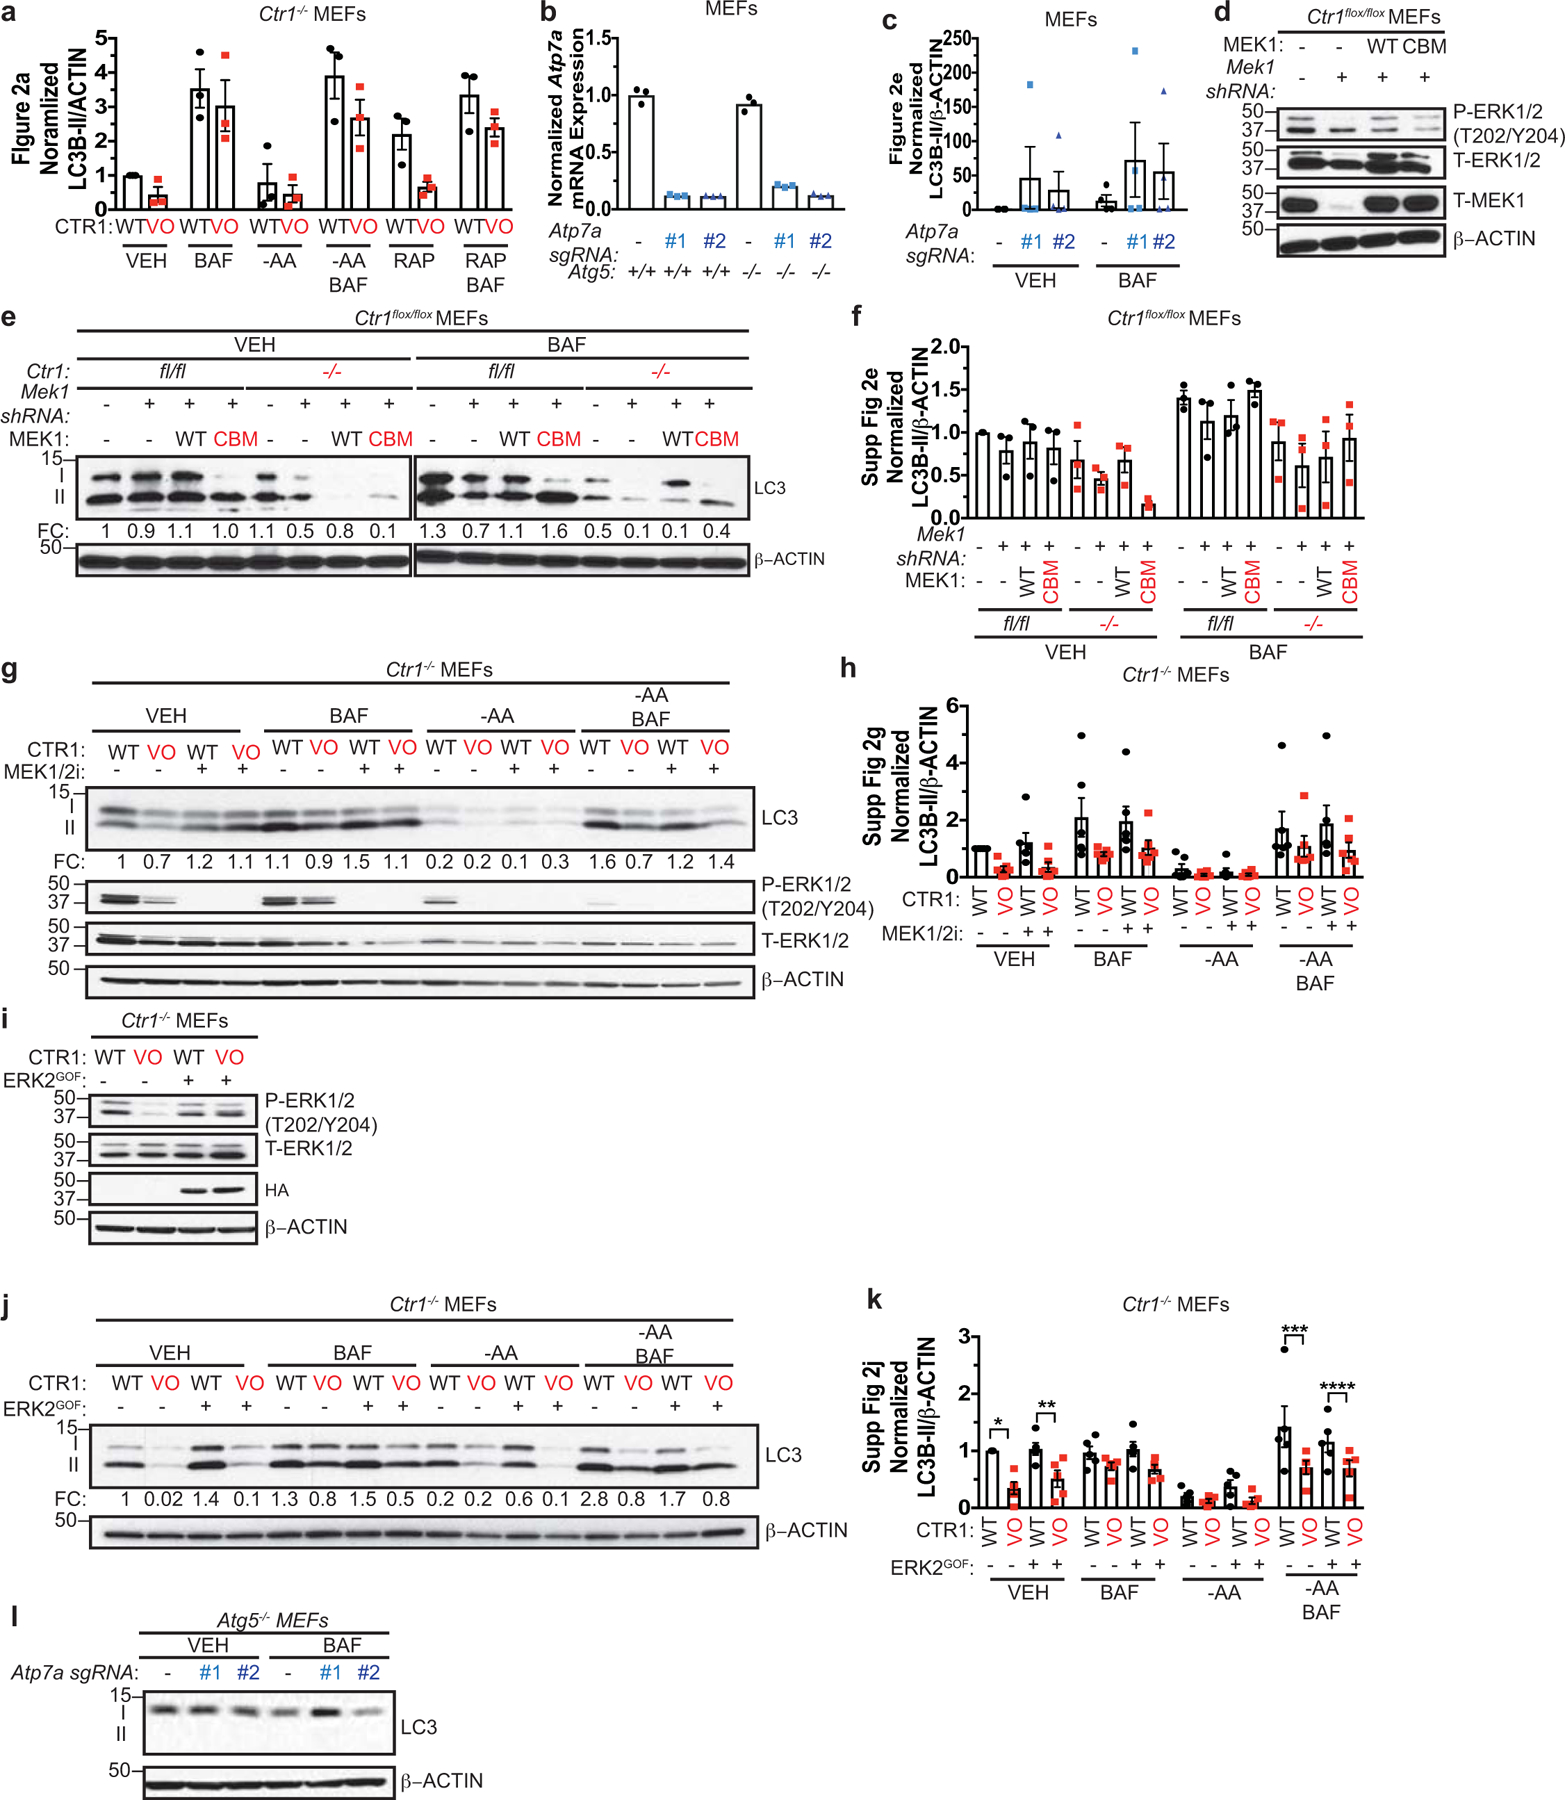
a, Scatter dot plot with bar at mean normalized ΔLC3-II/β-ACTIN from Figure 2a. n=3 biologically independent experiments. Results were compared using a two-way ANOVA followed by a Sidak’s multi-comparisons test. ns. b, Scatter dot plot with bar at mean normalized expression of Atp7a mRNA from MEFs n=1 biologically independent experiment performed in technical triplicate. c, Scatter dot plot with bar at mean normalized ΔLC3-II/β-ACTIN from Figure 2e. n=4 biologically independent experiments. Results were compared using a two-way ANOVA followed by a Sidak’s multi-comparisons test. ns. d, Immunoblot detection of proteins from MEFs. e, Immunoblot detection of proteins from treated MEFs. Quantification: ΔLC3-II/β-ACTIN normalized to fl/fl, empty vector (−), VEH control. f, Scatter dot plot with bar at mean normalized ΔLC3-II/β-ACTIN from Extended Data 2e. n=3 biologically independent experiments. Results were compared using a two-way ANOVA followed by a Tukey’s multi-comparisons test. ns. g, Immunoblot detection of proteins from treated MEFs. Quantification: ΔLC3-II/β-ACTIN normalized to WT, VEH control. h, Scatter dot plot with bar at mean normalized ΔLC3-II/β-ACTIN from Extended Data 2g. n=6 biologically independent experiments. Results were compared using a two-way ANOVA followed by a Tukey’s multi-comparisons test. ns. i, Immunoblot detection of proteins from MEFs. j, Immunoblot detection of proteins from treated MEFs. Quantification: ΔLC3-II/β-ACTIN normalized to WT, VEH control. k, Scatter dot plot with bar at mean normalized ΔLC3-II/β-ACTIN from Extended Data 2j. n=5 biologically independent experiments. Results were compared using a two-way ANOVA followed by a Tukey’s multi-comparisons test. *, P=0.0071; **, P=0.0434; ***, P=0.0026; ****, P=0.0021. l, Immunoblot detection of proteins from treated MEFs. Western blot images are representative of at least three biological replicates.