
Extended Data 3. Cu but not Fe is required for autophagosome formation and is associated with fluctuations in the Cu labile pool.
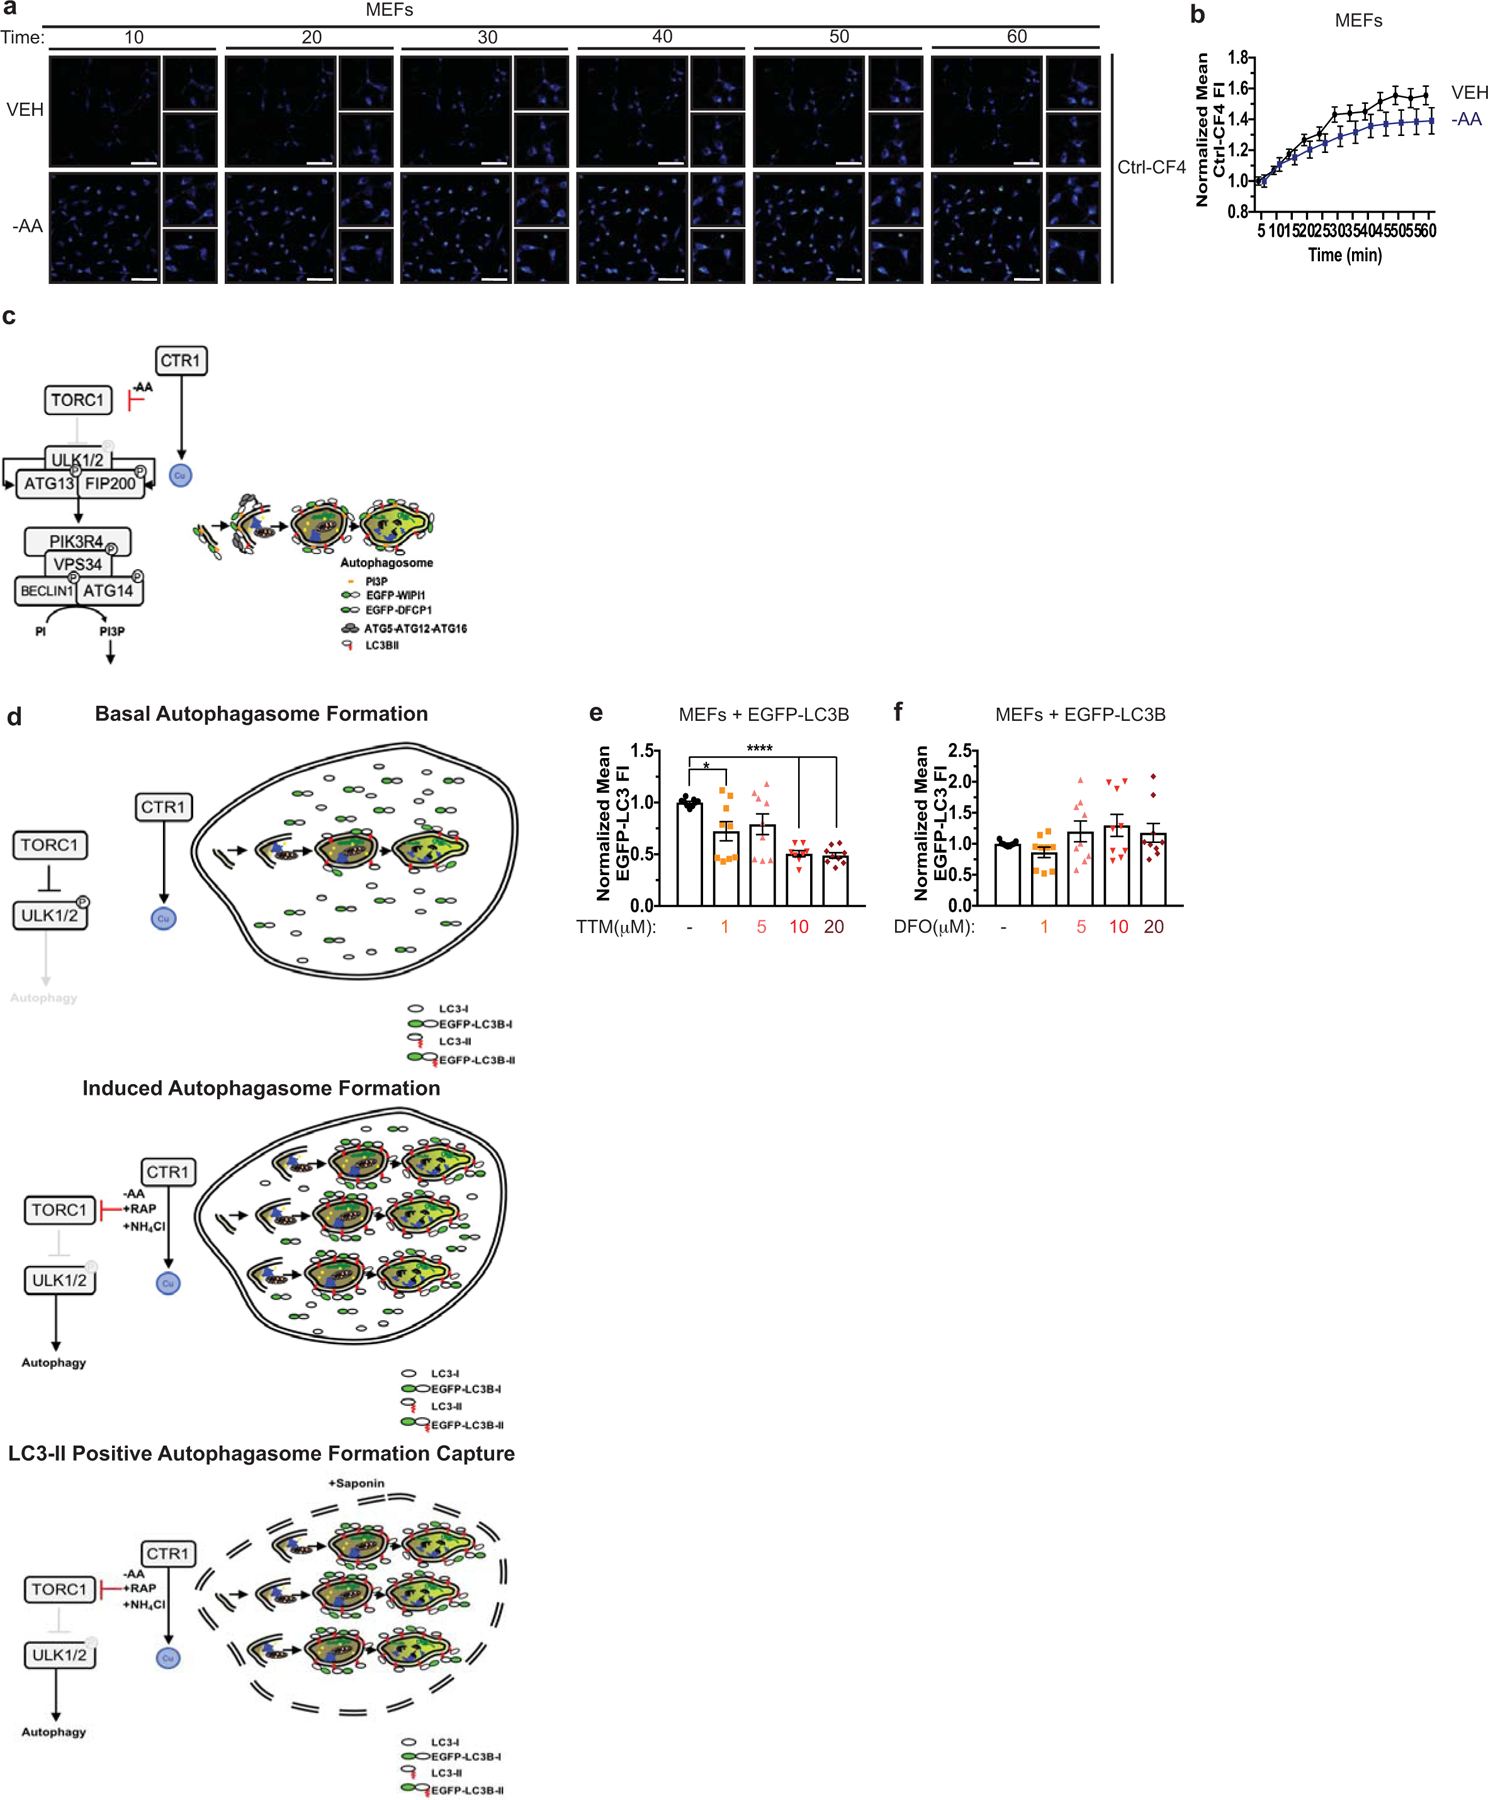
a, Representative live cell imaging of the Cu probe Ctrl-CF4 every ten minutes for 60 minutes from MEFs treated with vehicle (VEH) or amino acid deprivation (-AA). Scale bar, 100 μm. b, Mean Ctrl-CF4 fluorescence intensity (FI) ± s.e.m. versus time (minutes, min) from MEFs treated with VEH or -AA normalized to t=0, five minutes. n=30 individual cells. Results were compared using a two-way ANOVA followed by a Sidak’s multi-comparisons test. c, Schematic of immunofluorescence-based approach to access autophagosome formation. d, Schematic of flow cytometry-based approach to access autophagosome number. e,f, Scatter dot plot with bar at mean GFP-LC3 fluorescent intensity ± s.e.m. analyzed by flow cytometry from MEFs stably expressing EGFP-LC3B treated VEH or increasing concentrations of Cu chelator TTM (e) or Fe chelator DFO (f). n=9 biologically independent samples. Results were compared using a one-way ANOVA followed by a Dunnett’s multi-comparisons test. *, P=0.0148; ****, P<0.0001.