
Figure 8. Binding of Cu to ULK1 is required for KRASG12D-driven tumor growth and cancer cell survival in response to starvation.
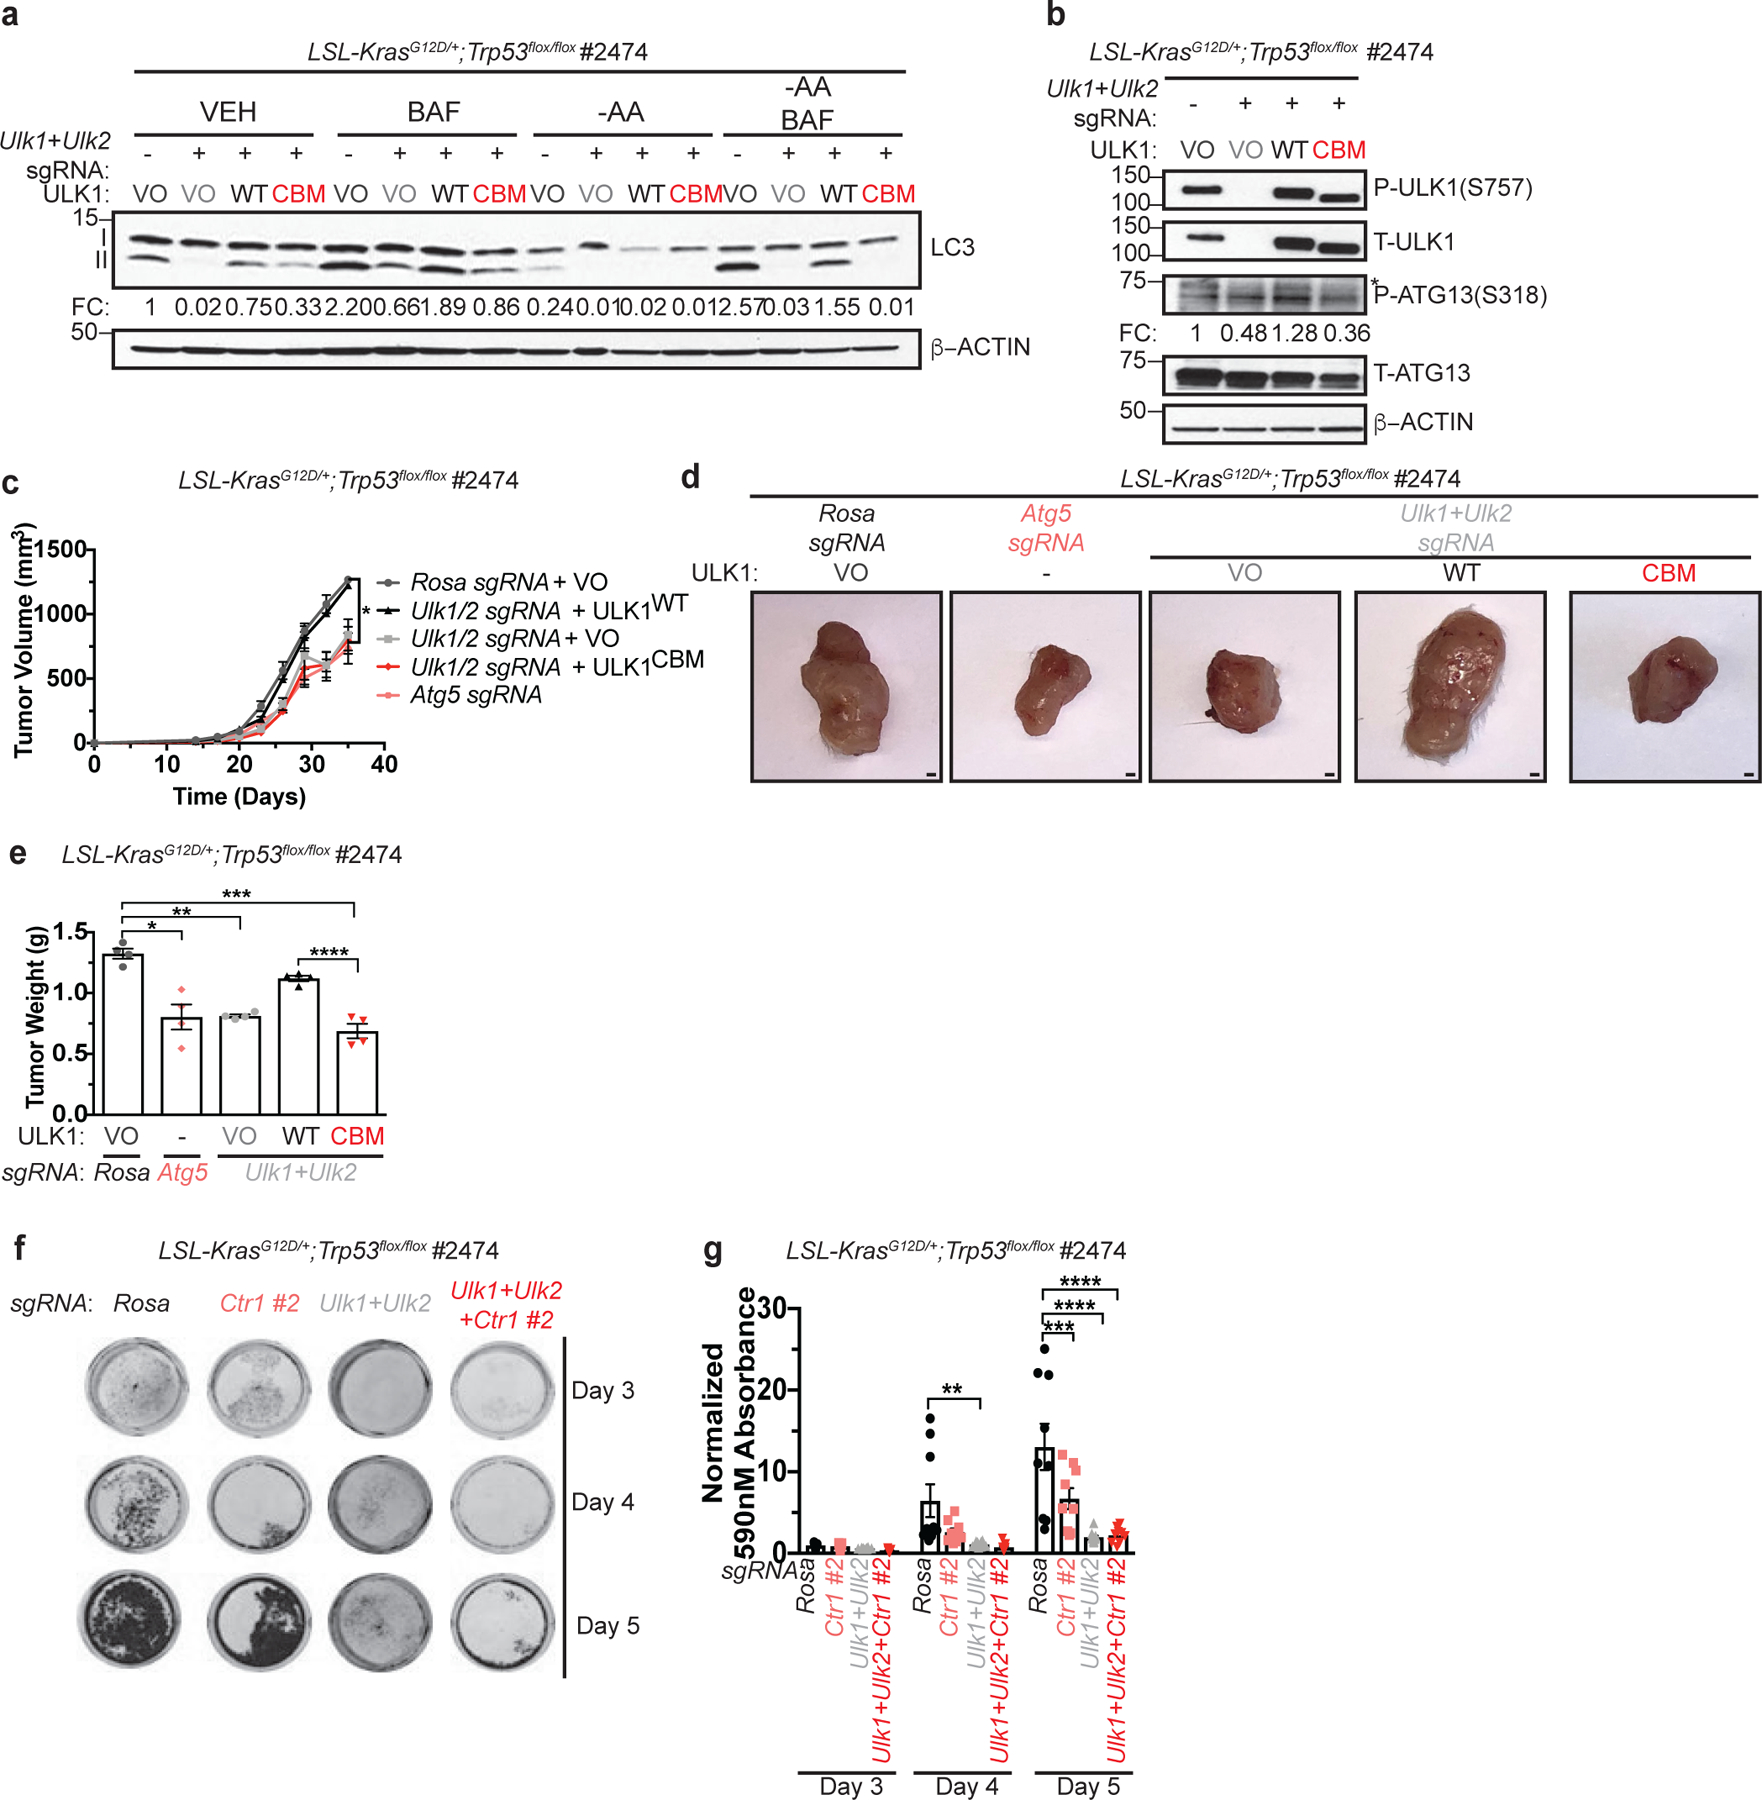
a, Immunoblot detection of proteins from treated KP cells. Quantification: ΔLC3-II/β-ACTIN normalized to Rosa (−), VO, VEH control. n=3 biologically independent experiments. b, Immunoblot detection of proteins from treated KP cells. Quantification: ΔP-ATG13/T-ATG13 normalized to Rosa (−), VO, VEH control. n=3 biologically independent experiments. c, Mean tumor volume (mm3) ± s.e.m. versus time (days) in mice injected with KP cells. n=4 biologically independent animals. Results were compared using a paired, two-tailed Student’s t-test. Rosa vs. Atg5, *, P=0.0228; Rosa vs. Ulk1/2, *, P=0.0176; Ulk1/2 vs. Ulk1/2 + ULK1WT, *, P=0.0199; Rosa vs. Ulk1/2 + ULK1CBM, *, P=0.0116; Ulk1/2 + ULK1WT vs. Ulk1/2 + ULK1CBM, *, P=0.0157. d, Representative dissected tumors from mice injected with KP cells. Scale bar, 100 μm. e, Scatter dot plot with bar at mean tumor weight (g) ± s.e.m. of KP tumors at endpoint. n=4 biologically independent animals. Results were compared using a two-way ANOVA followed by a Tukey’s multi-comparisons test. *, P=0.0001; **, P=0.0001; ***, P<0.0001; ****, P=0.0007. f, Representative crystal violet images of KP cells from days 3, 4, and 5 of recovery. g, Scatter dot plot with bar at mean absorbance of extracted crystal violet at 590nM ± s.e.m. of KP cells from days 3, 4, and 5 of recovery normalized to Rosa, day 3 control. N represents number of biologically independent samples. Rosa=9, Ctr1 #2 n=9, Ulk1/2 n=12, Ctr1 #2 + Ulk1/2 n=9. Results were compared using a two-way ANOVA followed by a Tukey’s multi-comparisons test. **, P=0.0010; ***, P=0.0002; ****, P<0.0001.