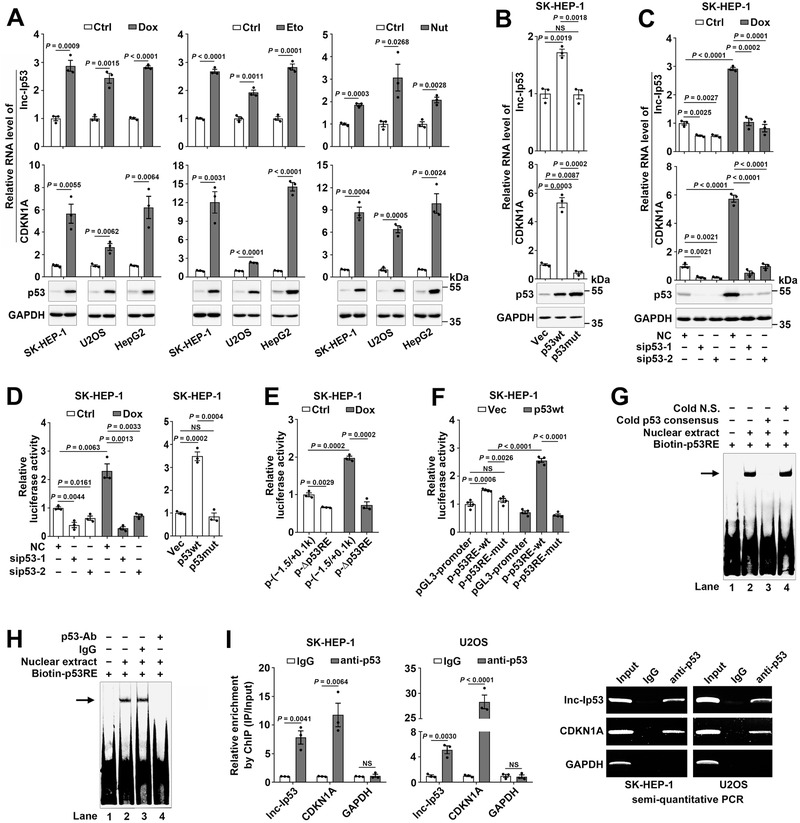
Figure 1.

Lnc‐Ip53 is a transcriptional target of p53. A) Various p53 activators induced the expression of lnc‐Ip53 along with CDKN1A and p53. Cells were treated for 12 h with 0.5 µM doxorubicin (Dox), 50 µM etoposide (Eto), 10 µM nutlin‐3a (Nut), or vehicle control (Ctrl: PBS as control for Dox, DMSO as control for Eto and Nut). B) Overexpression of wild‐type p53 (p53wt) but not R175H mutant p53 (p53mut) increased the lnc‐Ip53 level. Cells stably expressing p53wt, p53mut, or control vector (Vec) were used. C) Silencing p53 (sip53) decreased the lnc‐Ip53 level. Cells were transfected with the indicated RNA duplexes for 32 h, then incubated with PBS (Ctrl) or 0.5 µM Dox for 12 h. For (A–C), the mRNA level of CDKN1A was used as a positive control. D) sip53 reduced the activity of the lnc‐Ip53 promoter (left), whereas overexpressing p53wt but not p53mut increased its activity (right). E) Deletion of p53RE reduced the activity of the lnc‐Ip53 promoter. F) p53 enhanced the activity of pGL3‐promoter reporter containing wild‐type but not mutant p53RE. G,H) EMSA and antibody‐supershift assay verified the in vitro interaction of p53 with p53RE in the lnc‐Ip53 promoter. The biotin‐labeled DNA‐protein complexes are indicated by arrow. Cold N.S., nonspecific scrambled oligonucleotide. Nuclear extracts were from SK‐HEP‐1 cells. I) p53 interacted with the lnc‐Ip53 promoter in vivo. Cells were incubated with 0.5 µM Dox for 6 h before ChIP. The antibody‐precipitated DNAs were amplified by real‐time quantitative PCR (qPCR, left) and semi‐quantitative PCR for 35 cycles (right). The promoters of CDKN1A and GAPDH were used as positive and negative controls, respectively. + or −, cells with (+) or without (−) the indicated treatment. Data are shown as mean ± SEM of at least three independent experiments; p‐values were determined by unpaired Student′s t‐test; NS, not significant.
