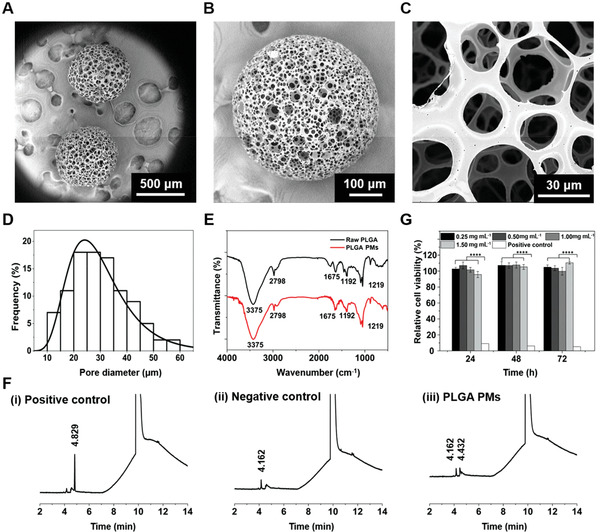
Figure 2.

Fabrication and characterizations of PLGA PMs. A–C) SEM images of the size distribution and the morphology of the PLGA PMs. D,E) Pore size distribution and FTIR analysis of the fabricated PLGA PMs. F) Analysis of organic solvent residues by GC. The solvents pure DMF, as well as a mixture of DCM in DMF (0.0045%, v/v), were used as negative and positive controls, respectively. G) Cytotoxicity test in vitro showing the viabilities of HepG2 cells after incubation with different concentrations of PLGA PMs leach solution (0.25, 0.50, 1.00, and 1.50 mg mL−1) at different exposure times (24, 48, and 72 h). The medium containing phenol (0.64%, v/v) was used as the positive control. ::::P < 0.0001.
