
Figure 5.
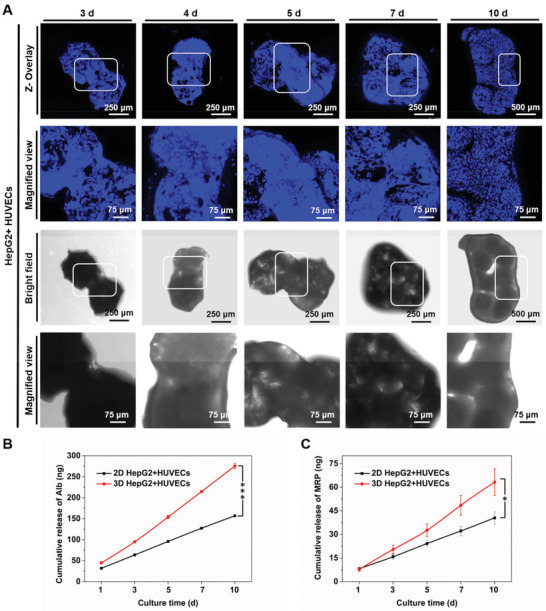
Evolution of multicellular tumor microtissue formation. A) Fluorescence and bright‐field microscopy images showing the growth of HepG2 cells and HUVECs on the PLGA PMs after 3, 4, 5, 7, and 10 d of coculture. The connections between the cell‐laden PLGA PMs were observed after 3 d (white squares), and the aggregation of these PLGA architectures was achieved with prolonged culture time. B) The release levels of Alb measured by ELISA. C) The release levels of MRP measured by ELISA. :P < 0.05 and :::P < 0.001.