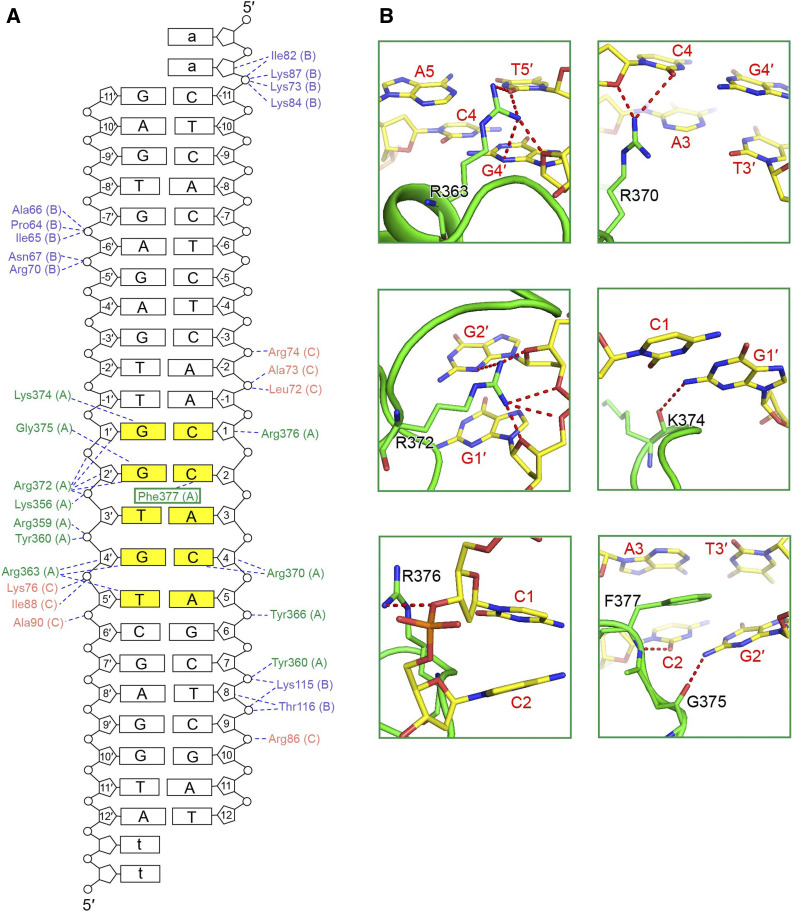
Figure 5.
Structural Basis of Specific DNA Recognition by the HD1CCT/GHD8/OsNF-YC2 Complex.
(A) Schematic illustration of protein–DNA interactions. Amino acids of HD1CCT, GHD8, and OsNF-YC2 are colored green, slate, and salmon, respectively. Dashed lines indicate H-bonds and salt bridges. The ‘CCACA’ motif is shaded in yellow.
(B) Specific recognition of the ‘CCACA’ motif by HD1CCT residues. The main chain of amino acids is shown as cartoons and the side chains are shown as sticks and colored green. Bases are shown as sticks and colored according to atom type (carbon, yellow; oxygen, red; nitrogen, blue; phosphorus, orange). Amino acids and nucleotides are labeled in black and red letters, respectively. All structure figures were prepared with the tool PyMOL.

