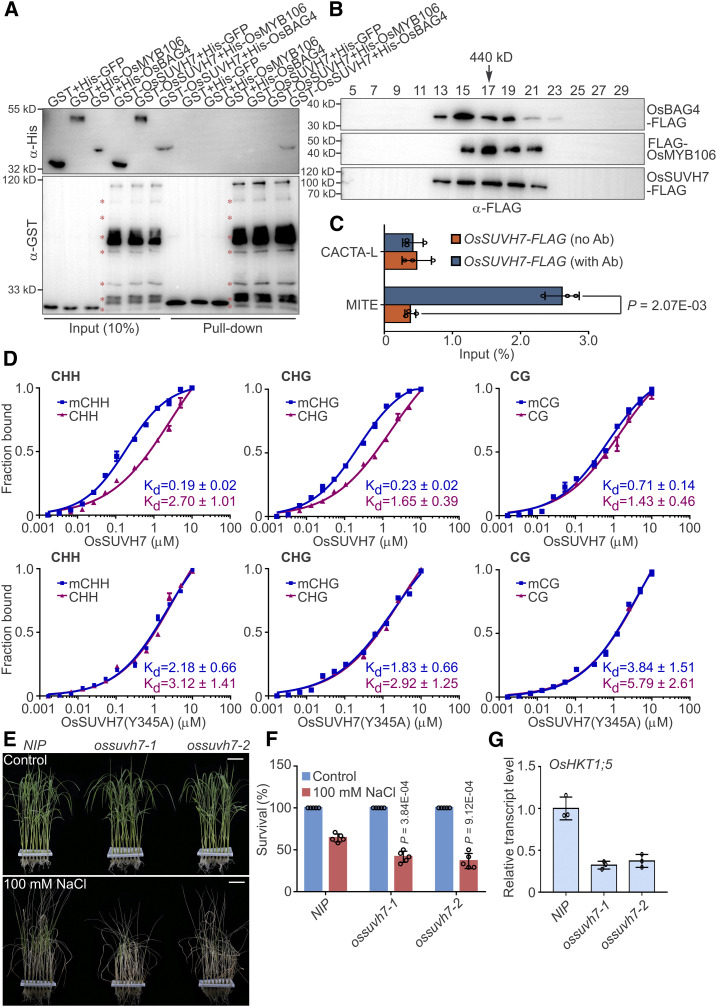
Figure 7.
DNA Methylation Reader OsSUVH7 Forms a Complex with OsBAG4 and OsMYB106 That Participates in the Salt Stress Response.
(A) In vitro pull-down assay to detect the direct interaction of OsSUVH7 with OsBAG4 and OsMYB106. GST-OsSUVH7 or GST were incubated with His-GFP, His-OsMYB106, or His-OsBAG4 and pulled down using glutathione–agarose beads, followed by immunoblotting with anti-His and anti-GST antibodies. Red asterisks indicate broken bands.
(B) Gel filtration analyses of OsBAG4, OsMYB106, and OsSUVH7 protein complex. Proteins extracted from protoplasts cotransfected with 35Spro:OsBAG4-FLAG (OsBAG4-FLAG), 35Spro:FLAG-OsMYB106 (FLAG-OsMYB106), and 35Spro:OsSUVH7-FLAG (OsSUVH7-FLAG) were eluted on a Superose 6 (10/300 GL) column and then the fractions were subjected to immunoblotting with anti-FLAG antibody.
(C) Results of ChIP-qPCR of rice roots showing that OsSUVH7 binds to the MITE site in the OsHKT1;5 promoter in vivo. CACTA-L and MITE are two TEs (TE, Transposon) within the OsHKT1;5 promoter (Figure 5A). Error bars indicate ±sd (n = 3, three biological replicates of ChIP experiments were performed for ChIP-qPCR). Individual values (black circle) were shown. Statistical analysis was performed by Student’s t test.
(D) FP binding assays to quantify the interaction of OsSUVH7 with methylated or unmethylated probes in CG, CHG, and CHH contexts. Top, the wild-type OsSUVH7. Bottom, OsSUVH7(Y345A) mutant, predicted to abrogate methyl binding. Binding affinities are indicated by Kd values. Error bars represent sd of technical replicates. Data are representative of two independent experiments.
(E) and (F) Images (E) and survival rates (F) of NIP and two independent ossuvh7 mutants (ossuvh7-1 and ossuvh7-2) before 100 mM NaCl treatment and after recovery from NaCl treatment. Data in (F) represent means ± sd (n = 5, five biological experiments were performed with 24 plants in each). Individual values (black circles) are shown. Statistical analyses were performed by Student’s t test. Bars in (E) = 3.9 cm.
(G) Expression levels of OsHKT1;5 in NIP and two independent ossuvh7 mutants. Data represent means ± sd (n = 3, five NIP or ossuvh7 seedlings were pooled and harvested for RNA extraction and RT-qPCR in each biological replicate). Individual values (black circles) are shown.

