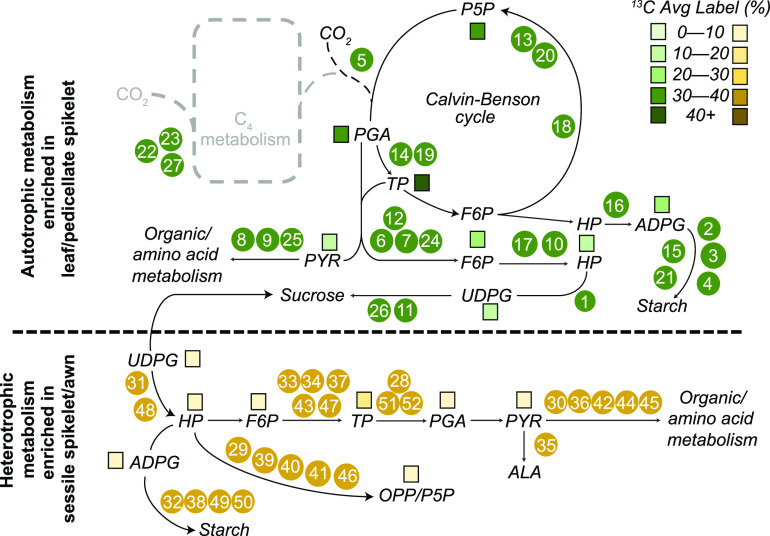
Figure 9.
Summary of Biochemical Pathways Assessed by 13C and RNA-Seq Data.
Numbered dots correspond to enzymes whose expression is shown in Figure 5. Colored squares reflect percent average label in 13C assays of metabolites. Top part of figure shows autotrophic metabolism and is enriched in the leaf and PS; bottom part of figure shows heterotrophic metabolism, enriched in the SS.

