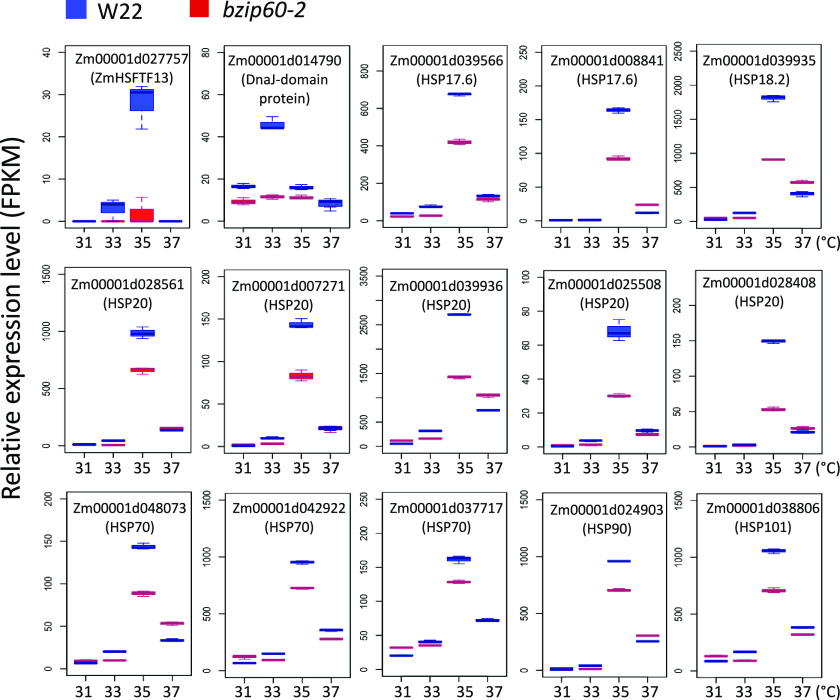
Figure 5.
Effect of bzip60-2 on the Expression of HSP Genes at Various MDTs.
Box plots show the relative expression levels (Fragments Per Kilobase of transcript per Million mapped reads) of HSP genes and a DnaJ gene (all Group-II genes) in bzip60-2 and W22 at different MDTs at the V5 stage (27 DAG). See legend in Figure 2F for an explanation of box-plot features.

