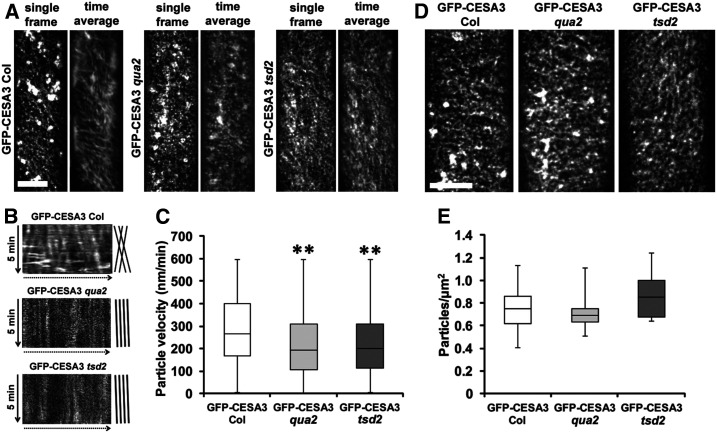
Figure 4.
CSC Motility Is Reduced in qua2 and tsd2 Etiolated Hypocotyls.
(A) Single frames and time averages of time-lapse data sets with 61 frames (5-min duration, 5-s interval) from 3-d-old etiolated GFP-CESA3 Col, GFP-CESA3 qua2, and GFP-CESA3 tsd2 hypocotyls showing GFP-CESA3 particles and trajectories. Bar = 10 μm.
(B) Kymographs of linear tracks showing movement directions of GFP-CESA3 particles in (A) from Col, qua2, and tsd2.
(C) Box plot of GFP-CESA3 particle velocity (n ≥ 965 particles from at least 11 cells per genotype). **, P < 0.001, Student’s t test.
(D) Maximum projections from z-series of 3-d-old etiolated seedlings expressing GFP-CESA3. Bar = 10 μm.
(E) Box plot of average particle density (n ≥ 9873 particles from at least 13 cells per genotype) from 3-d-old etiolated GFP-CESA3 Col, GFP-CESA3 qua2, and GFP-CESA3 tsd2 hypocotyls.
In (C) and (E), the bottom whisker is from minimum to quartile 1, the bottom box is from quartile 1 to median, the top box is from median to quartile 3, and the top whisker is from quartile 3 to maximum.

