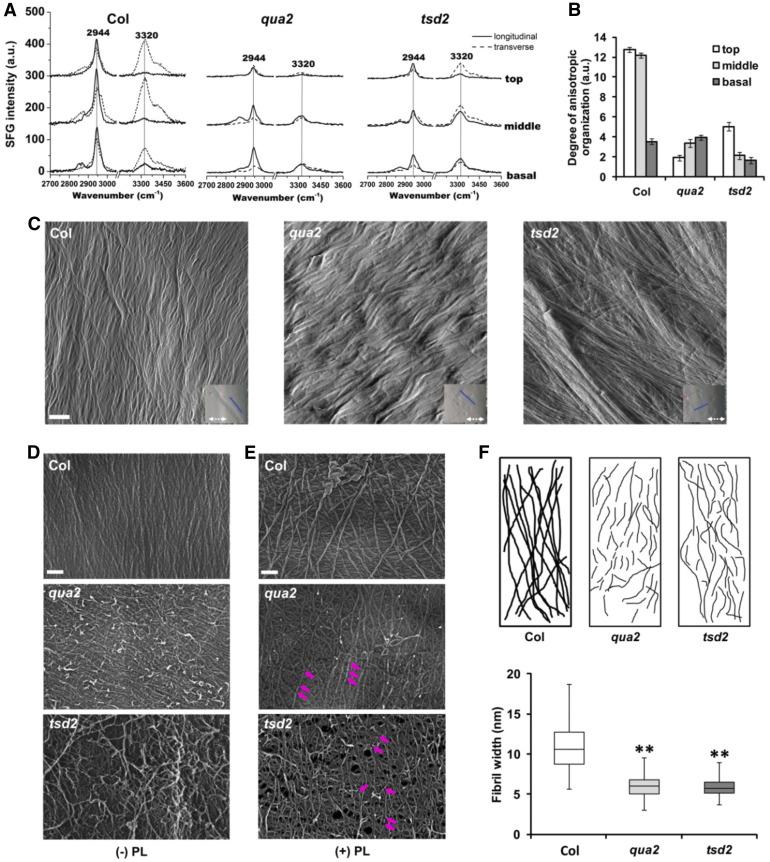
Figure 5.
Cellulose Is Disorganized in qua2 and tsd2 Etiolated Hypocotyls.
(A) SFG signal intensity from top, middle, and basal hypocotyl regions of 6-d-old etiolated Col, qua2, and tsd2 seedlings. a.u., Arbitrary units.
(B) Degree of anisotropic organization in fibrils of Col, qua2, and tsd2 genotypes (n = 6 location points from a bundle of 10 seedlings). Error bars represent se. a.u.,Arbitrary units.
(C) AFM images from top regions of 3-d-old etiolated Col, qua2, and tsd2 hypocotyls. Blue lines in inset images indicate cell long axis; white dashed arrows indicate scan direction. Bar = 200 nm.
(D) and (E) FESEM images from top regions of 3-d-old etiolated Col, qua2, and tsd2 hypocotyls without (D) and with (E) pectate lyase (PL) treatment. Purple arrows display the positions where fibrils were fragmented. Bars = 100 nm.
(F) Diagram of fibril patterning from FESEM images in (E).
(G) Quantification of fibril width from FESEM images (n ≥ 100 cellulose microfibrils from at least three images). The bottom whisker is from minimum to quartile 1, the bottom box is from quartile 1 to median, the top box is from median to quartile 3, and the top whisker is from quartile 3 to maximum. Error bars represent sd. **, P < 0.001, Student’s t test.

