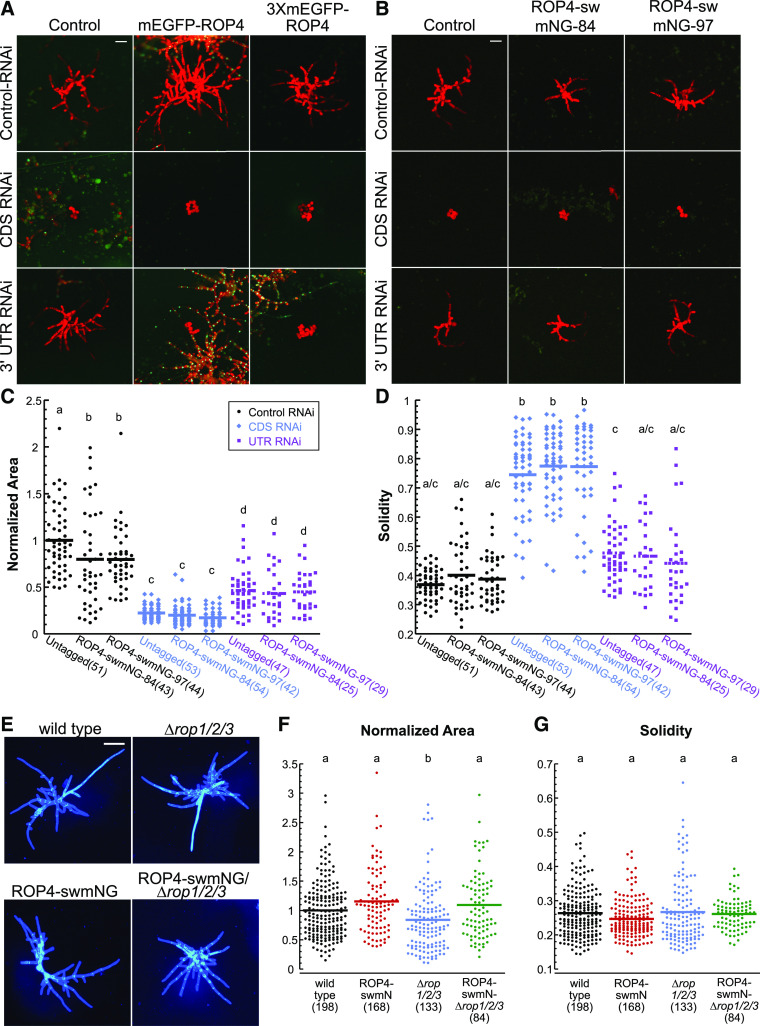
Figure 1.
ROP4 Is Functional When the Fluorescent Protein Is Inserted in a Loop within the Protein.
(A) and (B) Transient RNAi assay performed in a P. patens line containing a nuclear GFP:GUS reporter and a deletion of the ROP4 3′ UTR, which renders the ROP4 gene insensitive to the UTR-RNAi construct as described by Burkart et al. (2015). All RNAi constructs simultaneously silence the nuclear GFP:GUS reporter and the target genes, and the control construct only silences GFP:GUS. (A) Representative chlorophyll autofluorescence (red) images of 7-d-old plants regenerated from protoplasts. Control and N-terminally tagged ROP4 lines were transformed with the indicated RNAi constructs. Chlorophyll autofluorescence labels the plant, while loss of nuclear GFP signal indicates successfully silenced plants. Bar for all images = 100 µm. (B) Representative chlorophyll autofluorescence images of 7-d-old plants regenerated from protoplasts from control and sandwich-tagged ROP4 (ROP4-swmNG) transformed with the indicated constructs. Bar for all images = 100 µm.
(C) For the RNAi experiments represented in (B), the area of the chlorophyll autofluorescence was normalized to the chlorophyll autofluorescence area of plants transformed with the control plasmid.
(D) Solidity (convex hull area/area) for RNAi experiments represented in (B). Numbers in parentheses indicate the number of plants for each group. Legend of the graph in (C) also applies to (D) and indicates that black, blue, and purple represent data from protoplasts transformed with the control, CDS, or UTR RNAi constructs, respectively.
(E) Representative images of 7-d-old plants stained with calcofluor and regenerated from protoplasts from the wild type, ∆rop1/2/3, and ROP4-swmNG in the wild-type and ∆rop1/2/3 backgrounds. Bar = 200 µm.
(F) and (G) Normalized area (F) and solidity (G) for the sandwich-tagged ROP4 in the wild type (black) and ∆rop1/2/3 (magenta). Based on the Kolmogorov–Smirnov test, the data in (C), (D), (F), and (G) are normally distributed. Different letters in (C), (D), and (F) indicate groups with significantly different means, as determined by ANOVA with a Tukey’s HSD all pair comparison post test (α = 0.05). Also see Supplemental Tables 2 to 5.

