Figure 2.
Comparison of the Localization of the N-Terminally and Sandwich-Tagged ROP4 Proteins.
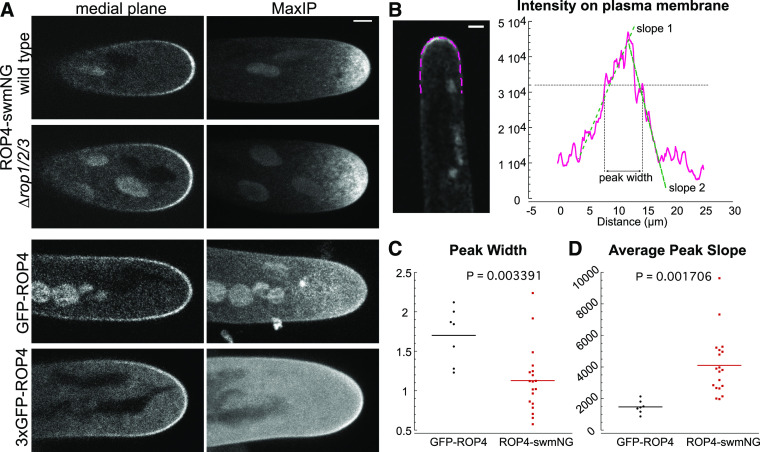
(A) Representative confocal images of growing moss protonemata of the indicated genotypes. Medial plane shows a single focal plane at the middle of the cell; MaxIP shows the maximum projection of a Z-stack taken through the entire cell volume. Bar for all images = 3 µm.
(B) Example image and measurement of ROP4-swmNG fluorescent signal along the plasma membrane. A 3-pixel-wide trace (magenta) of the plasma membrane was manually drawn and the normalized signal intensity along the line was plotted. Bar = 3 µm.
(C) Measurement of the peak width (indicated by the horizontal gray line) in (B) normalized to the cell width measured 10 µm from the cell tip. n = 7, GFP-ROP4; n = 19, ROP4-swmNG.
(D) Average of the slopes (slopes 1 and 2 in [B], green dashed lines). Slopes were determined by fitting a line to the points in the increasing and decreasing segment of the curve. Statistical analyses were performed using Student’s t test for unpaired data with equal variance with t probability indicated in the graph. Also see Supplemental Tables 6 and 7.

