Figure 3.
ROP4-swmng Enrichment Anticipates Cell Expansion, And Depends on the Cytoskeleton in Short Apical Cells.
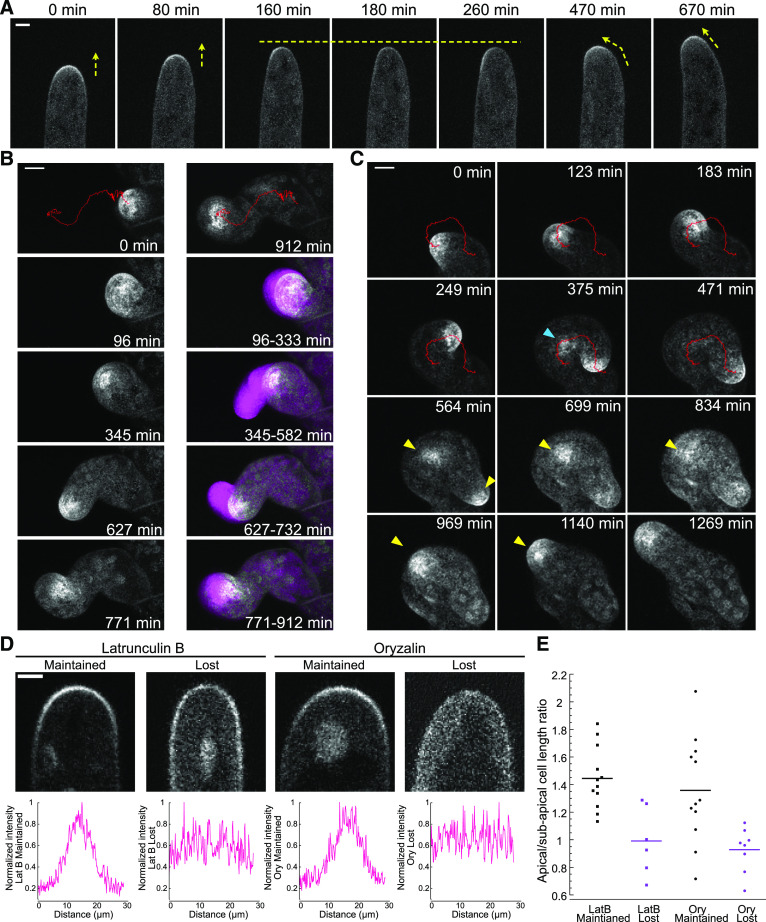
(A) Time-lapse imaging of a ROP4-swmNG/wild-type apical protonemal cell growing and pausing. Yellow arrows indicate growth direction; yellow dashed line indicates pause in growth. Bar for all images = 5 µm. Also see Supplemental Movie 1.
(B) and (C) Time-lapse acquisitions of ROP4-swmNG/wild-type protonemal cells treated with 12.5 µM oryzalin. Images were acquired in cells that grew from 1 to 120 h after drug addition. To accurately track the ROP4-swmNG signal, chloroplast autofluorescence was removed by subtracting the value of a fraction of chlorophyll autofluorescence intensity (*0.4 for [B] and *0.2 for [A] and [C]) from the mNG intensity in the maximum projections of confocal Z-stacks. Red traces were generated by TrackMate using the processed images to track the ROP4-swmNG signal at the growing tip, which mirrored the growth pattern of the cell. (B) Example of one cell switching between isotropic and polarized growth. The images at the top are the first and last time points, with the trace in red of the mNG signal for the entire time course. Four distinct events are depicted in this time course: isotropic swelling (96 to 333 min), polarized growth with small changes in direction (345 to 582 min), large change in direction (627 to 732 min), and pause in growth (771 to 912 min). The first time points for each of these events are shown on the left and are maximum projections of Z-stacks. The right panel shows the overlay of the ROP4-swmNG enrichment in the first time point (gray), with a projection of the subsequent time points (every 3 min) for the subsequent period of time indicated in the bottom right corner of each image (magenta). Bar for all images = 10 µm. Also see Supplemental Movie 2. (C) Example of one cell continuously turning (0 to 471 min) and later developing a new polarized growth site (yellow arrowheads). Blue arrowhead indicates ectopic accumulation of the ROP4-swmNG signal that later diminished and did not lead to subsequent growth. Bar for all images = 10 µm. Also see Supplemental Movie 3.
(D) Example confocal images of ROP4-swmNG/wild type, and signal intensity quantification of protonemal apical cell tips after drug treatment. Graphs were generated by measuring the signal intensity along a manually drawn line tracing the plasma membrane of the cell. Bar for all images = 3 µm. LatB, latrunculin B.
(E) Quantification of the ratio between apical-to-subapical cell length for cells that lost or maintained the apical ROP gradient after drug treatment. Protonemal cells from ROP4-swmNG/wild type were exposed to 25 µM latrunculin B (LatB) or 12.5 µM oryzalin for 5 to 60 min and were imaged using confocal microscopy. Cell lengths were measured during image acquisition. n = 12, 6, 12, and 8 for each category, respectively.

