Figure 1.
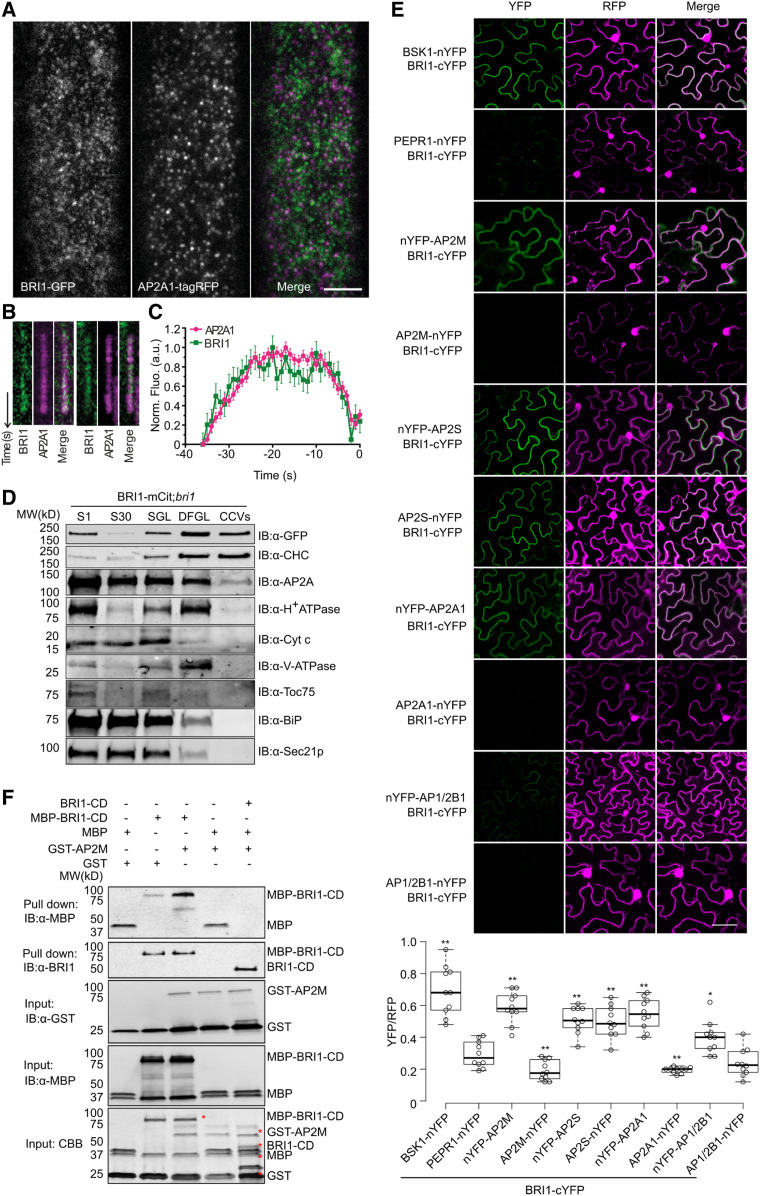
BRI1 Binds Directly to AP-2.
(A) TIRFM imaging of root epidermal cells of Arabidopsis BRI1-GFP;AP2A1-tagRFP;bri1-116 plants. Bar = 5 μm.
(B) Kymographs of colocalizing foci.
(C) Departure assay plot of the normalized fluorescence of foci positive for both AP2A1 and BRI1 with the mean cell surface lifetime. Error bars indicate sd (n = 6, cells; n = 657, mean tracks; n = 6882, colocalized tracks). a.u., arbitrary units.
(D) BRI1 fractionated with AP2A and clathrin in the CCV fraction. CCVs were prepared from total plant extracts of 7-d-old BRI1-mCitrine (BRI1-mCit);bri1 seedlings. Samples were collected during CCV purification and subjected to immunoblot (IB) analyses with antibodies against CHC, GFP, AP2A, and various subcellular organelle marker proteins. S1, supernatant after centrifugation at 1000g; S30, supernatant after centrifugation at 30,000g; SGL, Suc step gradient load; CCV, CCV-containing fraction; DFGL, linear deuterium oxide/Ficoll gradient load. The following antibodies were used as organelle- or compartment-specific markers: α-H+ATPase (PM), α-Cyt c (mitochondria), α-V-ATPase (vacuole), α-TOC75 (chloroplast), α-BiP (endoplasmic reticulum), and α-SEC21p (COP-I vesicle). MW, molecular weight.
(E) rBiFC analysis of BRI1 with different AP-2 subunits in N. benthamiana leaf epidermal cells. The combinations BSK1-nYFP/BRI1-cYFP and PEPR1-nYFP/BRI1-cYFP were used as positive and negative controls, respectively. Quantification of the ratio of the YFP fluorescence signal against RFP for different combinations is shown at the bottom. Box plots show the first and third quartiles, split by the medians (lines), with whiskers extending 1.5-fold interquartile range beyond the box. n = 10, cells. P-values (one-way ANOVA and Tukey’s post hoc), *P < 0.05, **P < 0.01 relative to the PEPR1-nYFP/BRI1-cYFP control. Bar = 10 μm.
(F) BRI1 interaction with AP2M in vitro. Free MBP, MBP-fused BRI1-cytoplasmic domain (CD; MBP-BRI1-CD), or MBP-BRI1-CD together with BRI1-CD was incubated with glutathione beads coupled with GST or GST-AP2M. The beads were collected and washed, followed by immunoblotting with α-MBP and α-BRI1. The protein inputs were determined by α-GST, α-MBP immunoblotting and Coomassie Brilliant Blue (CBB) staining. The positions of the corresponding proteins are labeled with red asterisks in the CBB panel.

