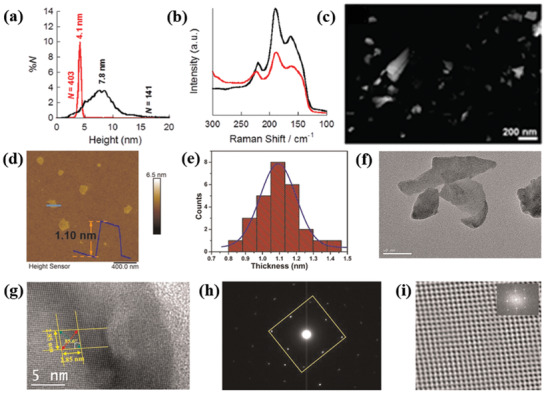
Figure 7.

Liquid phase exfoliated SnS nanosheets: a) Particle size distribution for NS height, as determined for SnS sol‐A (black curve) and SnS sol‐B (red curve); b) Raman scattering spectra of SnS samples; c) low‐resolution high‐angle annular dark‐field (HAADF) scanning transmission electron microscopy (STEM) image of SnS. Reproduced with permission.[ 34 ] Copyright 2015, American Chemical Society. As‐synthesized ultrathin SnS layers: d) atomic force microscopy image (scale bar: 400 nm); e) histograms of thickness distribution; f) low‐resolution TEM image (scale bar: 50 nm); g) HRTEM image (scale bar: 5 nm). The length of lattice fringes (ten fringes) was measured to be 2.85 nm along both different directions. h) SAED pattern. i) Fast Fourier transform (FFT) filtered atomic resolution of the selected area. Inset: FFT pattern of the selected region in HRTEM image. Adapted with permission.[ 110 ] Copyright 2020, Author(s), licensed under a Creative Commons Attribution 4.0 License, Nature Publishing Journal.
