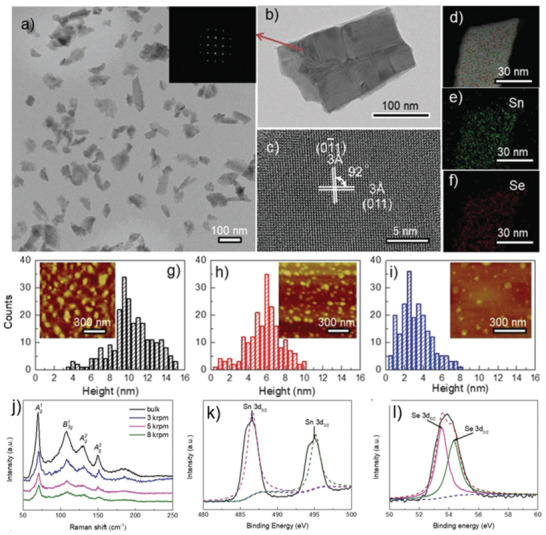
Figure 8.

a) TEM image of exfoliated SnSe NSs; b) a single SnSe flake (inset: FFT image of the SnSe NS in (b)); c) HRTEM image of SnSe NSs; d–f) STEM image and the elemental mapping of Sn and Se; g–i) histogram of thickness distribution and inset shows corresponding AFM images of exfoliated SnSe NSs collected at various centrifugation speeds; j) Raman spectra of bulk SnSe and exfoliated NSs; k,l) high‐resolution XPS spectra of core level of Sn 3d and Se 3d region. Reproduced with permission.[ 149 ] Copyright 2019, Wiley‐VCH.
