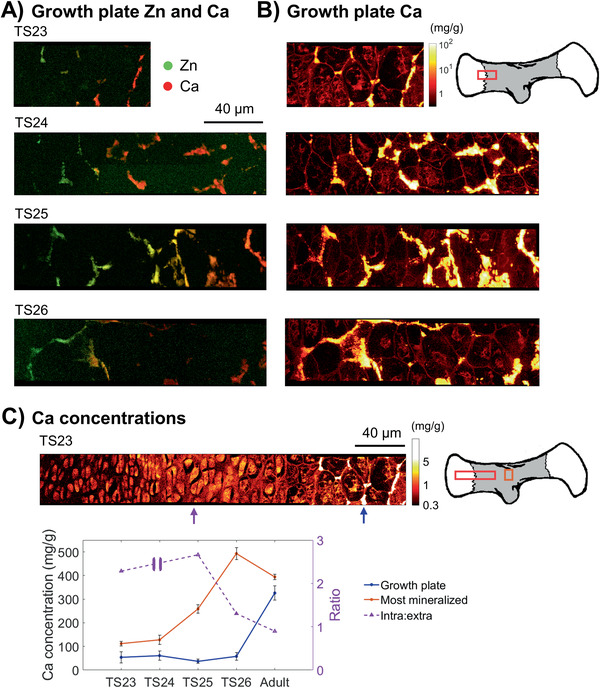
Figure 5.

Nanometer‐resolved spatial elemental concentration across growth plates in embryonic mice humeri. A) Combined Ca and Zn XRF intensity map from the mineralization front of the high‐resolution growth plate scans acquired at MAX IV with a pixel size of 200 nm, where Ca is red and Zn green (overlap is yellow). B) Only Ca concentration (logarithmic scale) of the same region of the growth plate, where chondrocytes, ECM and mineralized regions (yellow/white) can be observed. The values are given in mg g−1 and the brighter the pixel, the higher the concentration. Note that this scale is set to 0.3–100 mg g−1 for all age groups, but that the maximum Ca concentration goes up to around 150 mg g−1 for some of them. C) A representative Ca concentration (logarithmic scale) map from the whole growth plate (ROI of growth plate and most mineralized region indicated by the red and orange boxes respectively in the sketch to the right) at TS23. Please note that the scale has been set from 0.3 to 5 mg g−1 to better visualize the intracellular concentrations of around 2 mg g−1. A comparison of the average Ca concentration of a mineralized cluster at the beginning of mineralization (≈2 chondrocytes into mineralization, blue arrow in growth plate map), the most mineralized regions (bone collar or middle of rudiments, orange box in sketch) and the ratio of the average Ca concentration within and outside three cells of the proliferative zone (purple arrow in growth plate map) with age is shown (N = 1). Please note that the ratio is on the secondary y‐axis.
