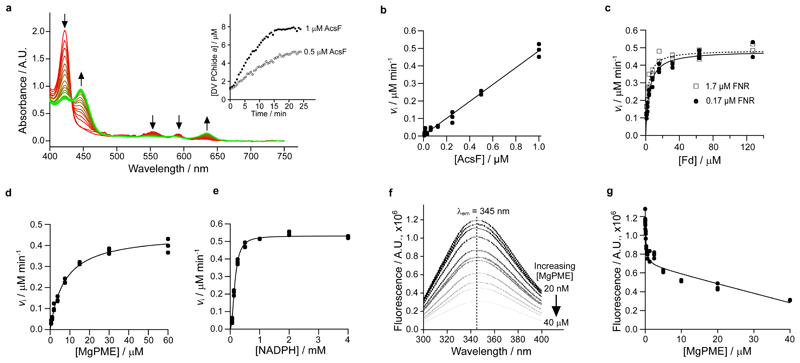
Fig. 3. Steady-state kinetics of AcsF, and binding of MgPME to AcsF analysed by tryptophan fluorescence quenching.
a, The progressive spectral change during a continuous absorbance-based cyclase assay, which contained 1 µM AcsF, 10 µM MgPME, 7.6 µM Anabaena Fd, 0.17 µM Anabaena FNR, 2.5 mM NADPH and 0.29 mg mL-1 catalase. Arrows indicate the direction of change. Inset shows the product (DV PChlide a) evolution with 0.5 and 1 µM AcsF, monitored by absorbance at 634 nm. b–e, The dependence of the initial rate of product formation on AcsF (b), Anabaena Fd (c), MgPME (d) and NADPH (e). Assay conditions were as in a except the following stated differences: b, 7.81 nM to 1 µM AcsF; c, 0.5 µM AcsF, 0.17 or 1.7 µM Anabaena FNR, 0.99 to 127 µM Anabaena Fd; d, 0.5 µM AcsF, 1.7 µM Anabaena FNR, 31 µM Anabaena Fd; e, 0.5 µM AcsF, 30 µM MgPME, 1.7 µM Anabaena FNR, 31 µM Anabaena Fd, 62.5 µM to 4 mM NADPH. Each data point is an independent experiment. The Michaelis-Menten equation (equation 1, see Materials and Methods) was fitted to the kinetic data in c and d, with the characterising parameters K M (apparent) = 4.05 ± 0.39 µM (0.17 µM FNR) or 2.41 ± 0.26 µM (1.7 µM FNR) (c); = 0.91 ± 0.02 min-1, = 7.03 ± 0.51 µM (d). The Hill equation (equation 2, see Materials and Methods) was fitted to the NADPH titration data with = 1.06 ± 0.01 min-1, = 0.16 ± 0.01 mM, n = 2.1 ± 0.1 (e). f, A series of spectra showing quenching of AcsF fluorescence by MgPME. Excitation was set at 280 nm, producing an emission maximum at 345 nm. The average fluorescence spectra of triplicate experiments are shown. g, Plot of AcsF fluorescence against MgPME concentration. Each data point is an independent experiment. The curve fit is described by a modified single-site binding model (equation 3, see Materials and Methods) with K d for MgPME binding of 0.16 ± 0.05 µM.

