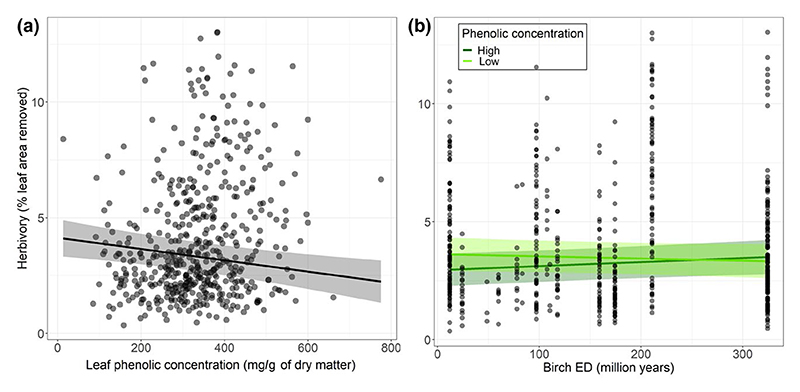
Figure 4.
Relationship (a) between insect herbivory and leaf phenolic concentration and (b) between insect herbivory and birch evolutionary distinctiveness (ED) for different levels of leaf phenolic concentration. The figure shows observed data (points) as well as model predictions (solid lines) and standard errors (shaded areas). ‘Low’ and ‘high’ phenolic concentration levels corresponded to 0.25 and 0.75 quartiles of the observed phenolic concentration range, respectively. The predictors that were not involved in the relationships shown were set at median values to compute predictions

